01 of May of 2025
Automated Google Ads Reports with Looker Studio

Isaac Correa
Looker Studio Templates
Data Integration & Sources
Build automated Google Ads reports in Looker Studio. Monitor campaigns, analyze results, and deliver reports in real time—without spreadsheets.
Advertising Reports: What to Include and How to Build Them in Looker Studio
Clear metrics. Smarter decisions. Zero manual work.
Advertising reports are essential for understanding how your paid campaigns are performing across channels like Google Ads and beyond. But too often, reporting becomes a repetitive, manual task—building slides, exporting data, and explaining the same KPIs over and over.
This guide will show you how to create an advertising report that answers the right questions, includes the right sections, and can be fully automated using Looker Studio.
What Should an Advertising Report Answer?
 Every advertising report should do more than just list numbers. It should tell a story. Here are the core questions your report needs to answer:
- How many people engaged with your ads (clicks, CTR, conversions)?
- What’s the ROI for each campaign?
- Where is your ad spend most efficient (by platform, region, or audience)?
- How do impressions and clicks correlate with conversions?
- Which campaigns or demographics deliver the best results?
- Are engagement or conversion trends moving up or down?
- How does current performance compare to previous periods or benchmarks?
An effective ad report gives you strategic clarity—not just data dumps.
Key Sections to Include in Your Advertising Report
The structure of your advertising report will depend on your platform, audience, and goals. But most reports should include the following sections:
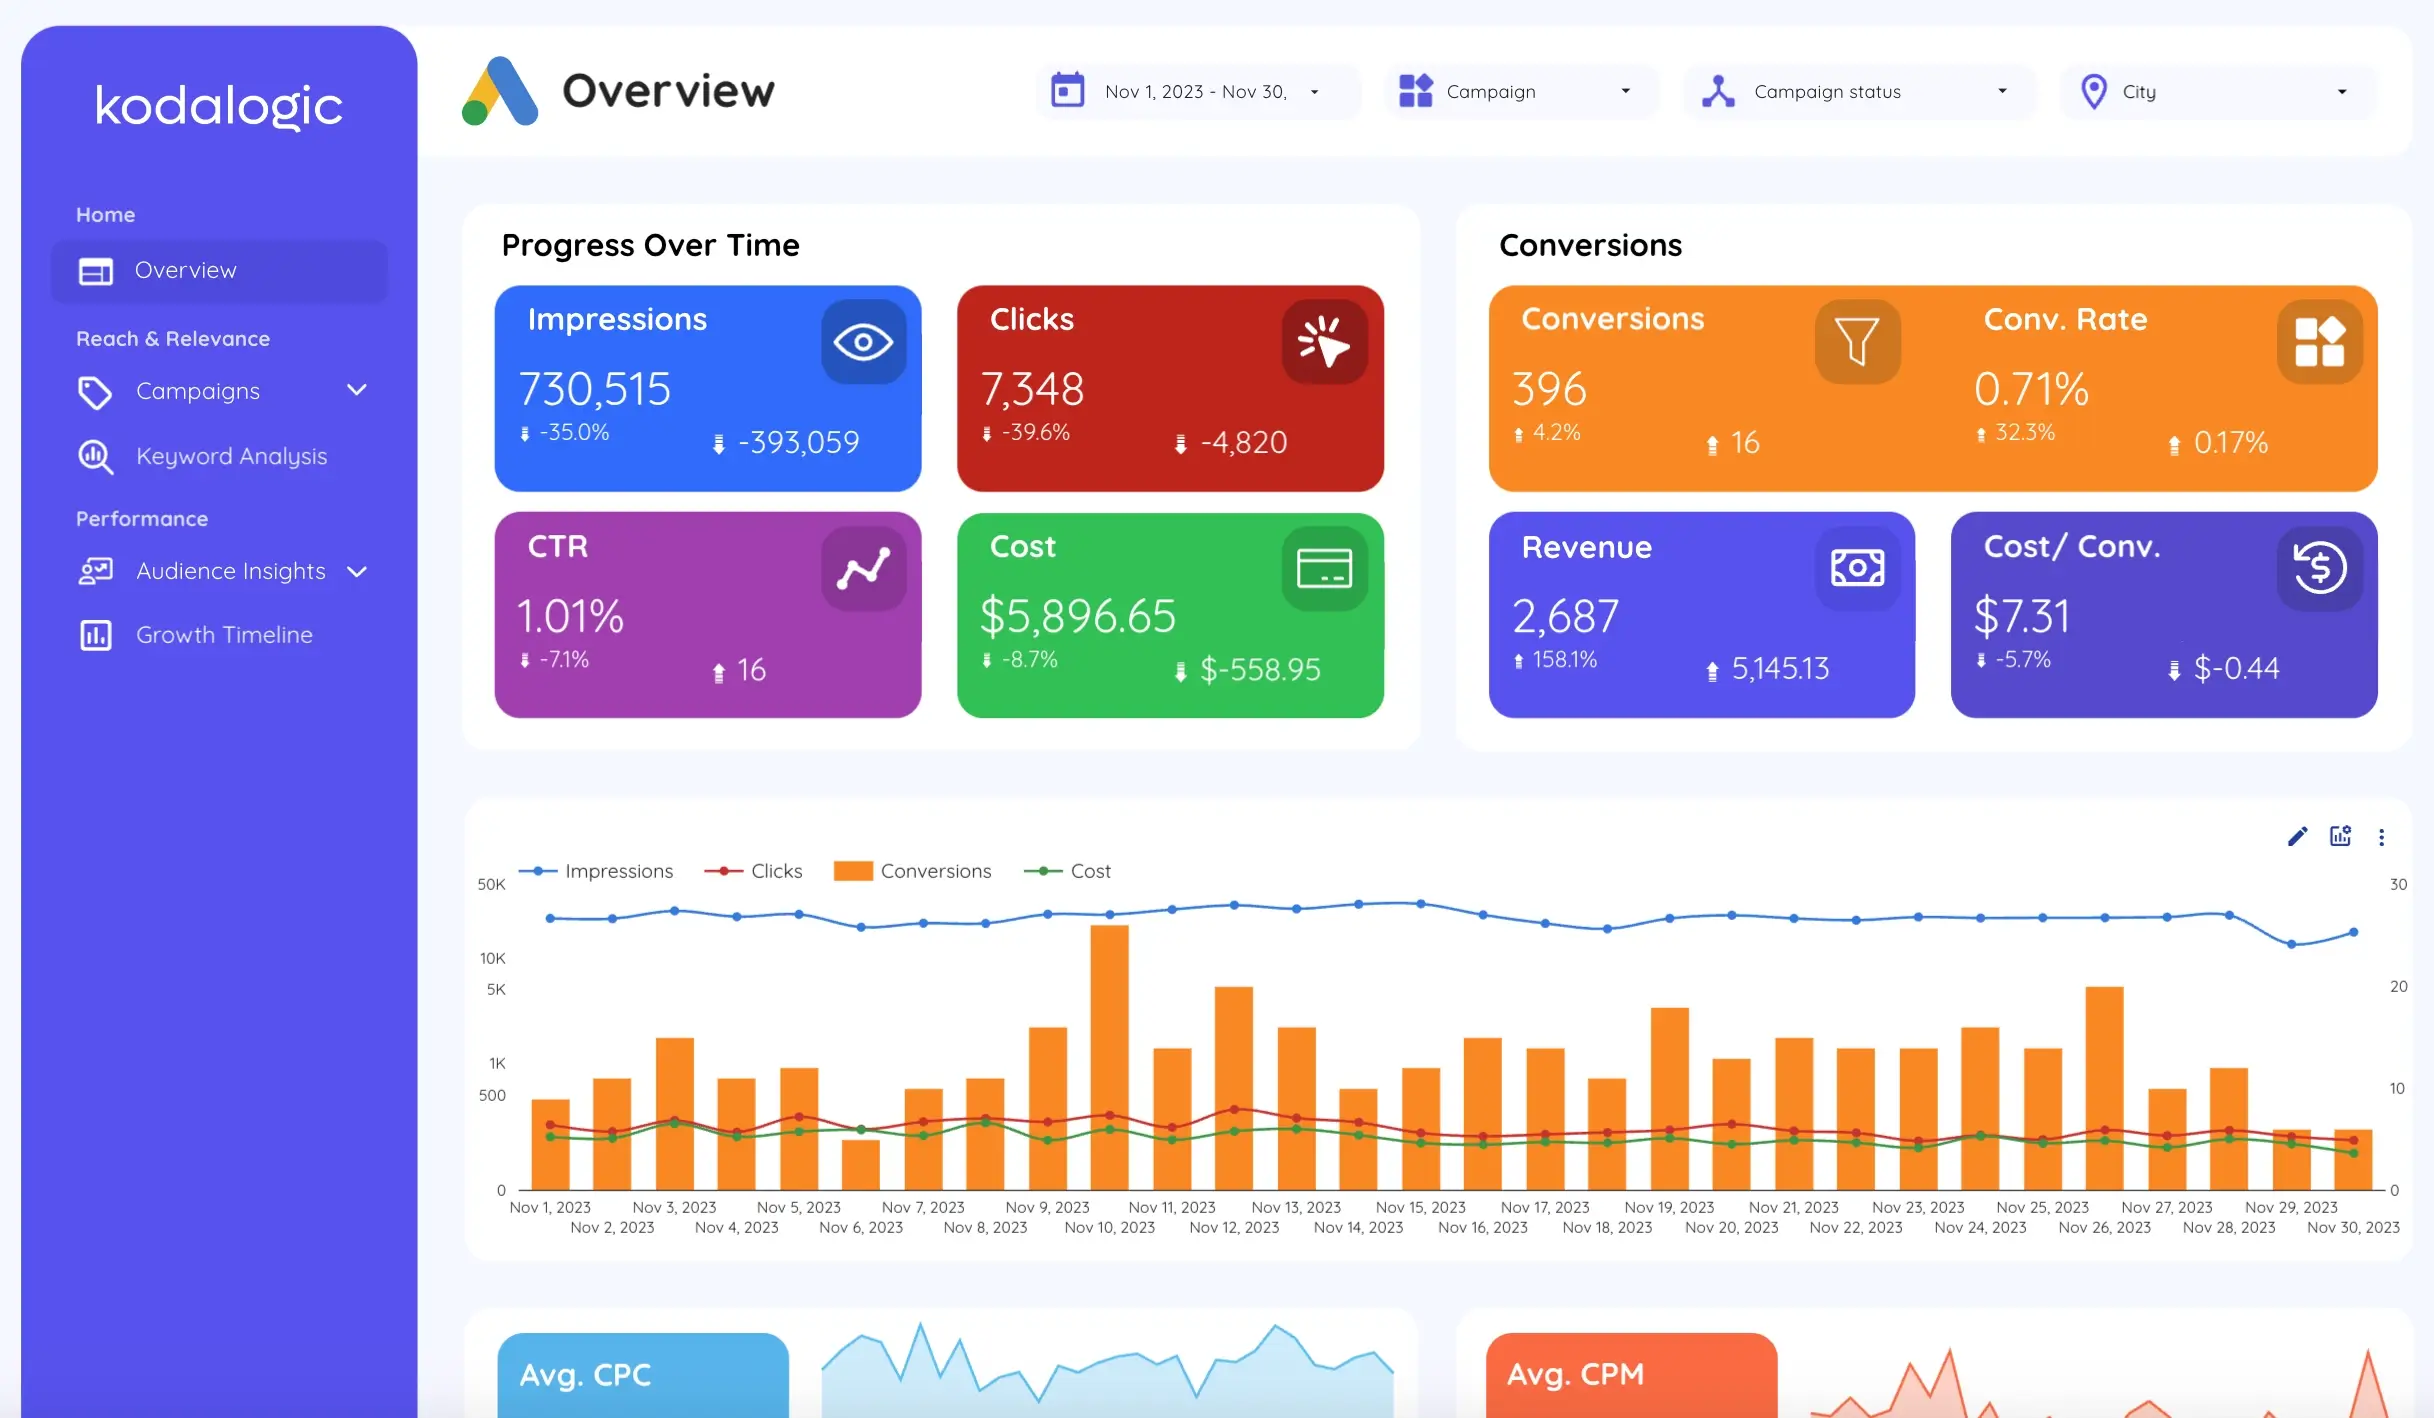
Overview Section
This section gives readers an instant snapshot of ad performance. It’s ideal for clients, executives, or busy stakeholders.
Include core KPIs like:
- Total ad spend
- Number of clicks
- Conversions
- Top performing campaigns
You can also add a short summary explaining what’s in the report and why it matters.
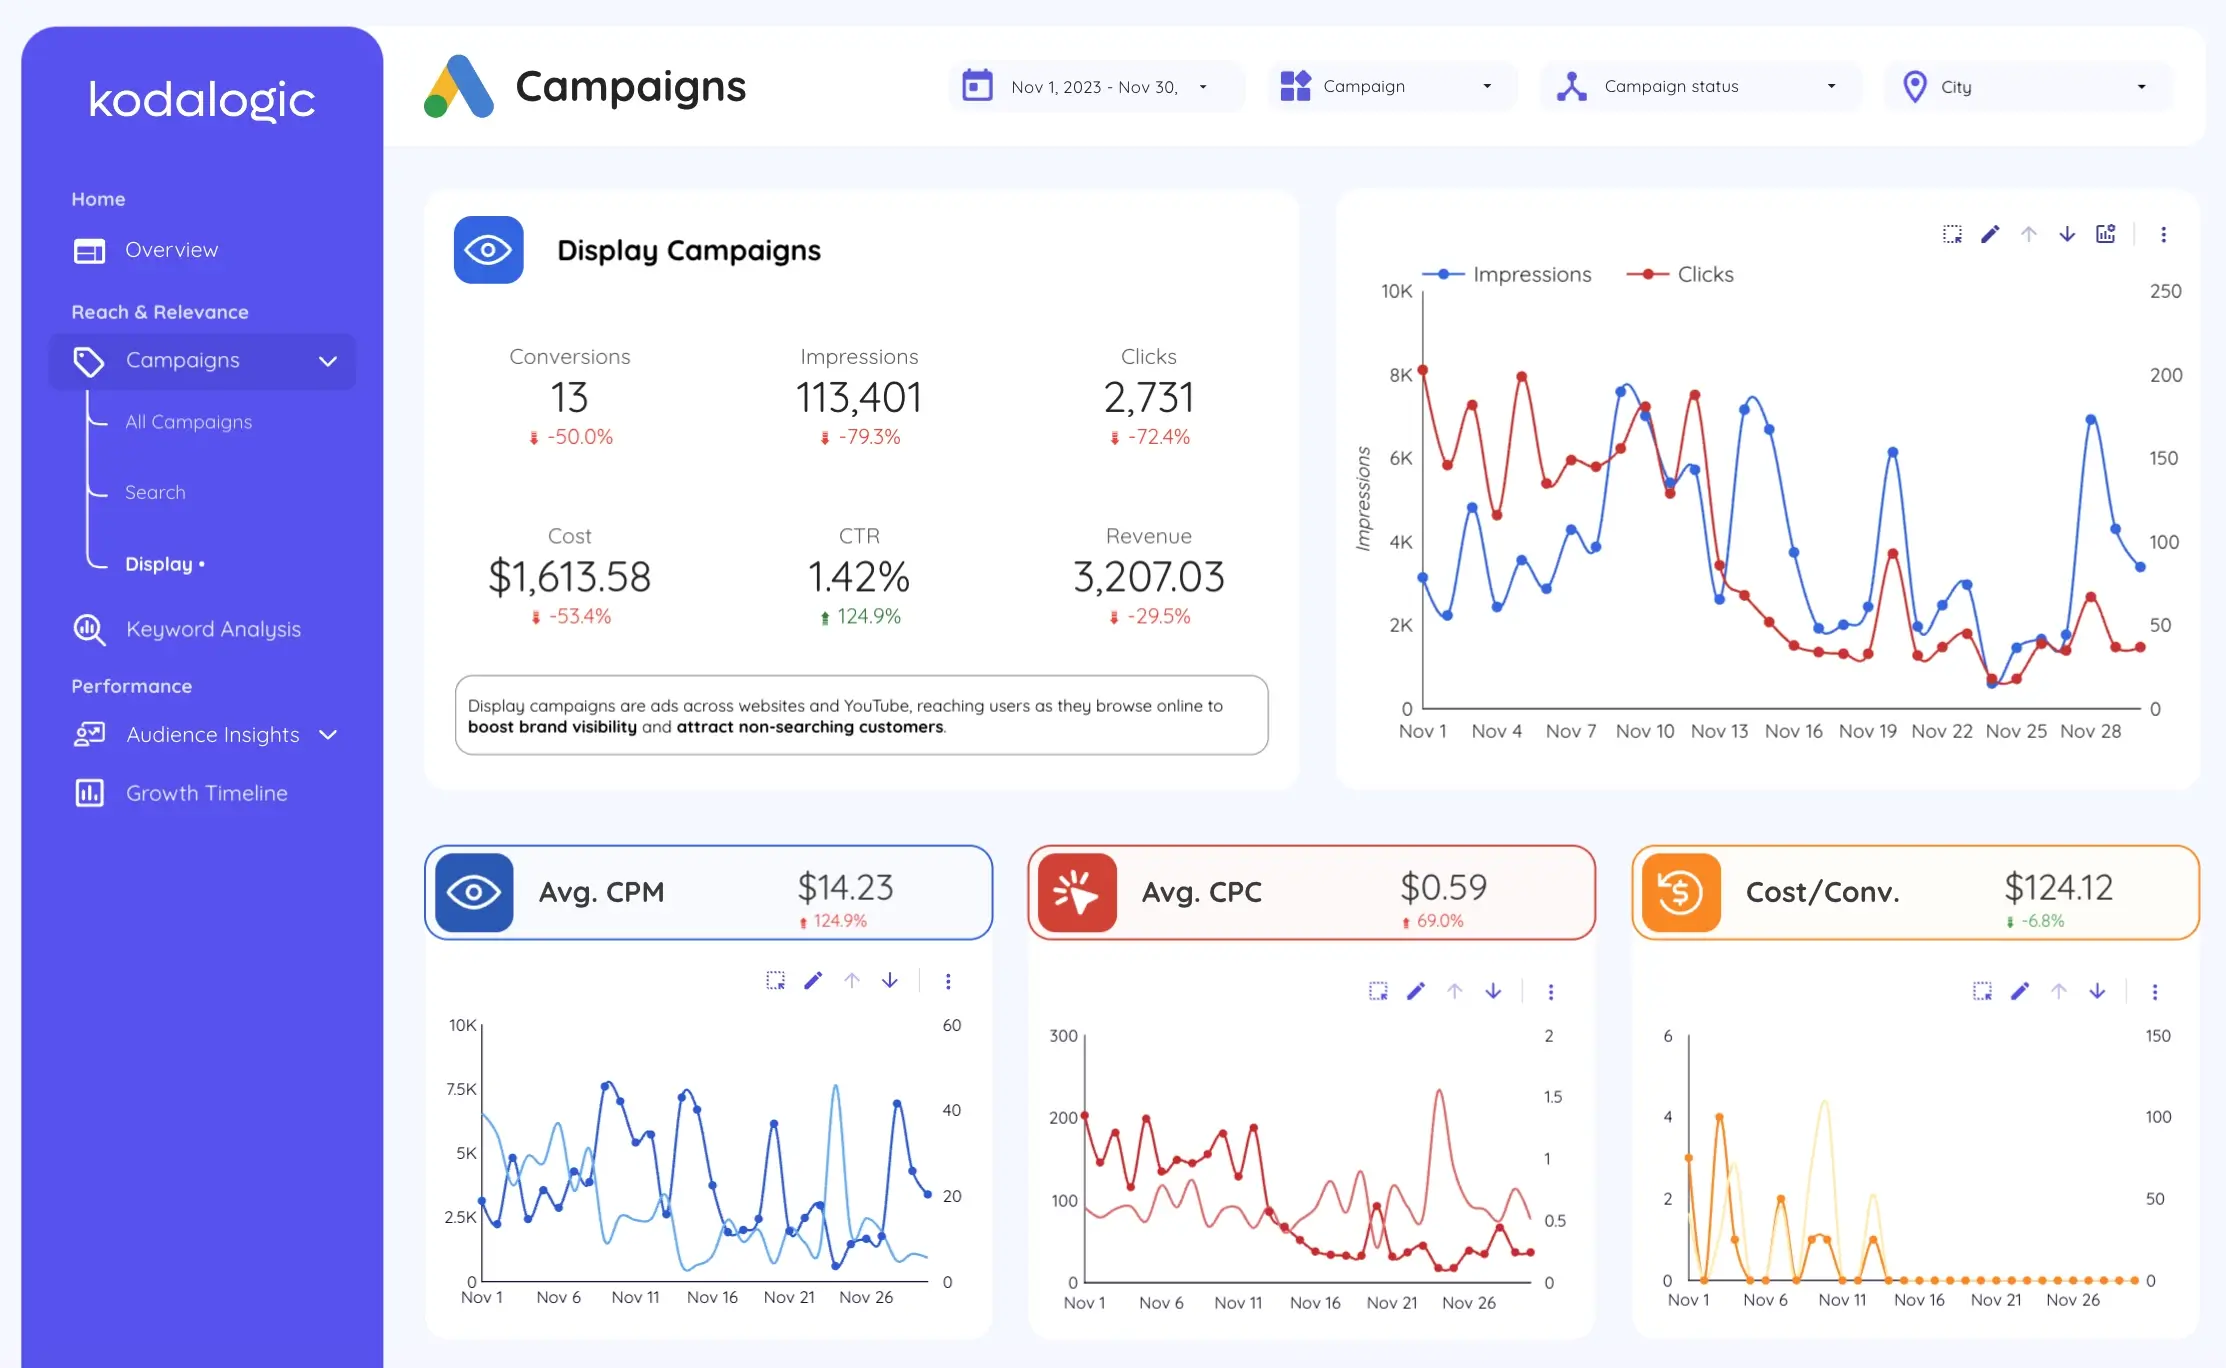
Campaign Performance
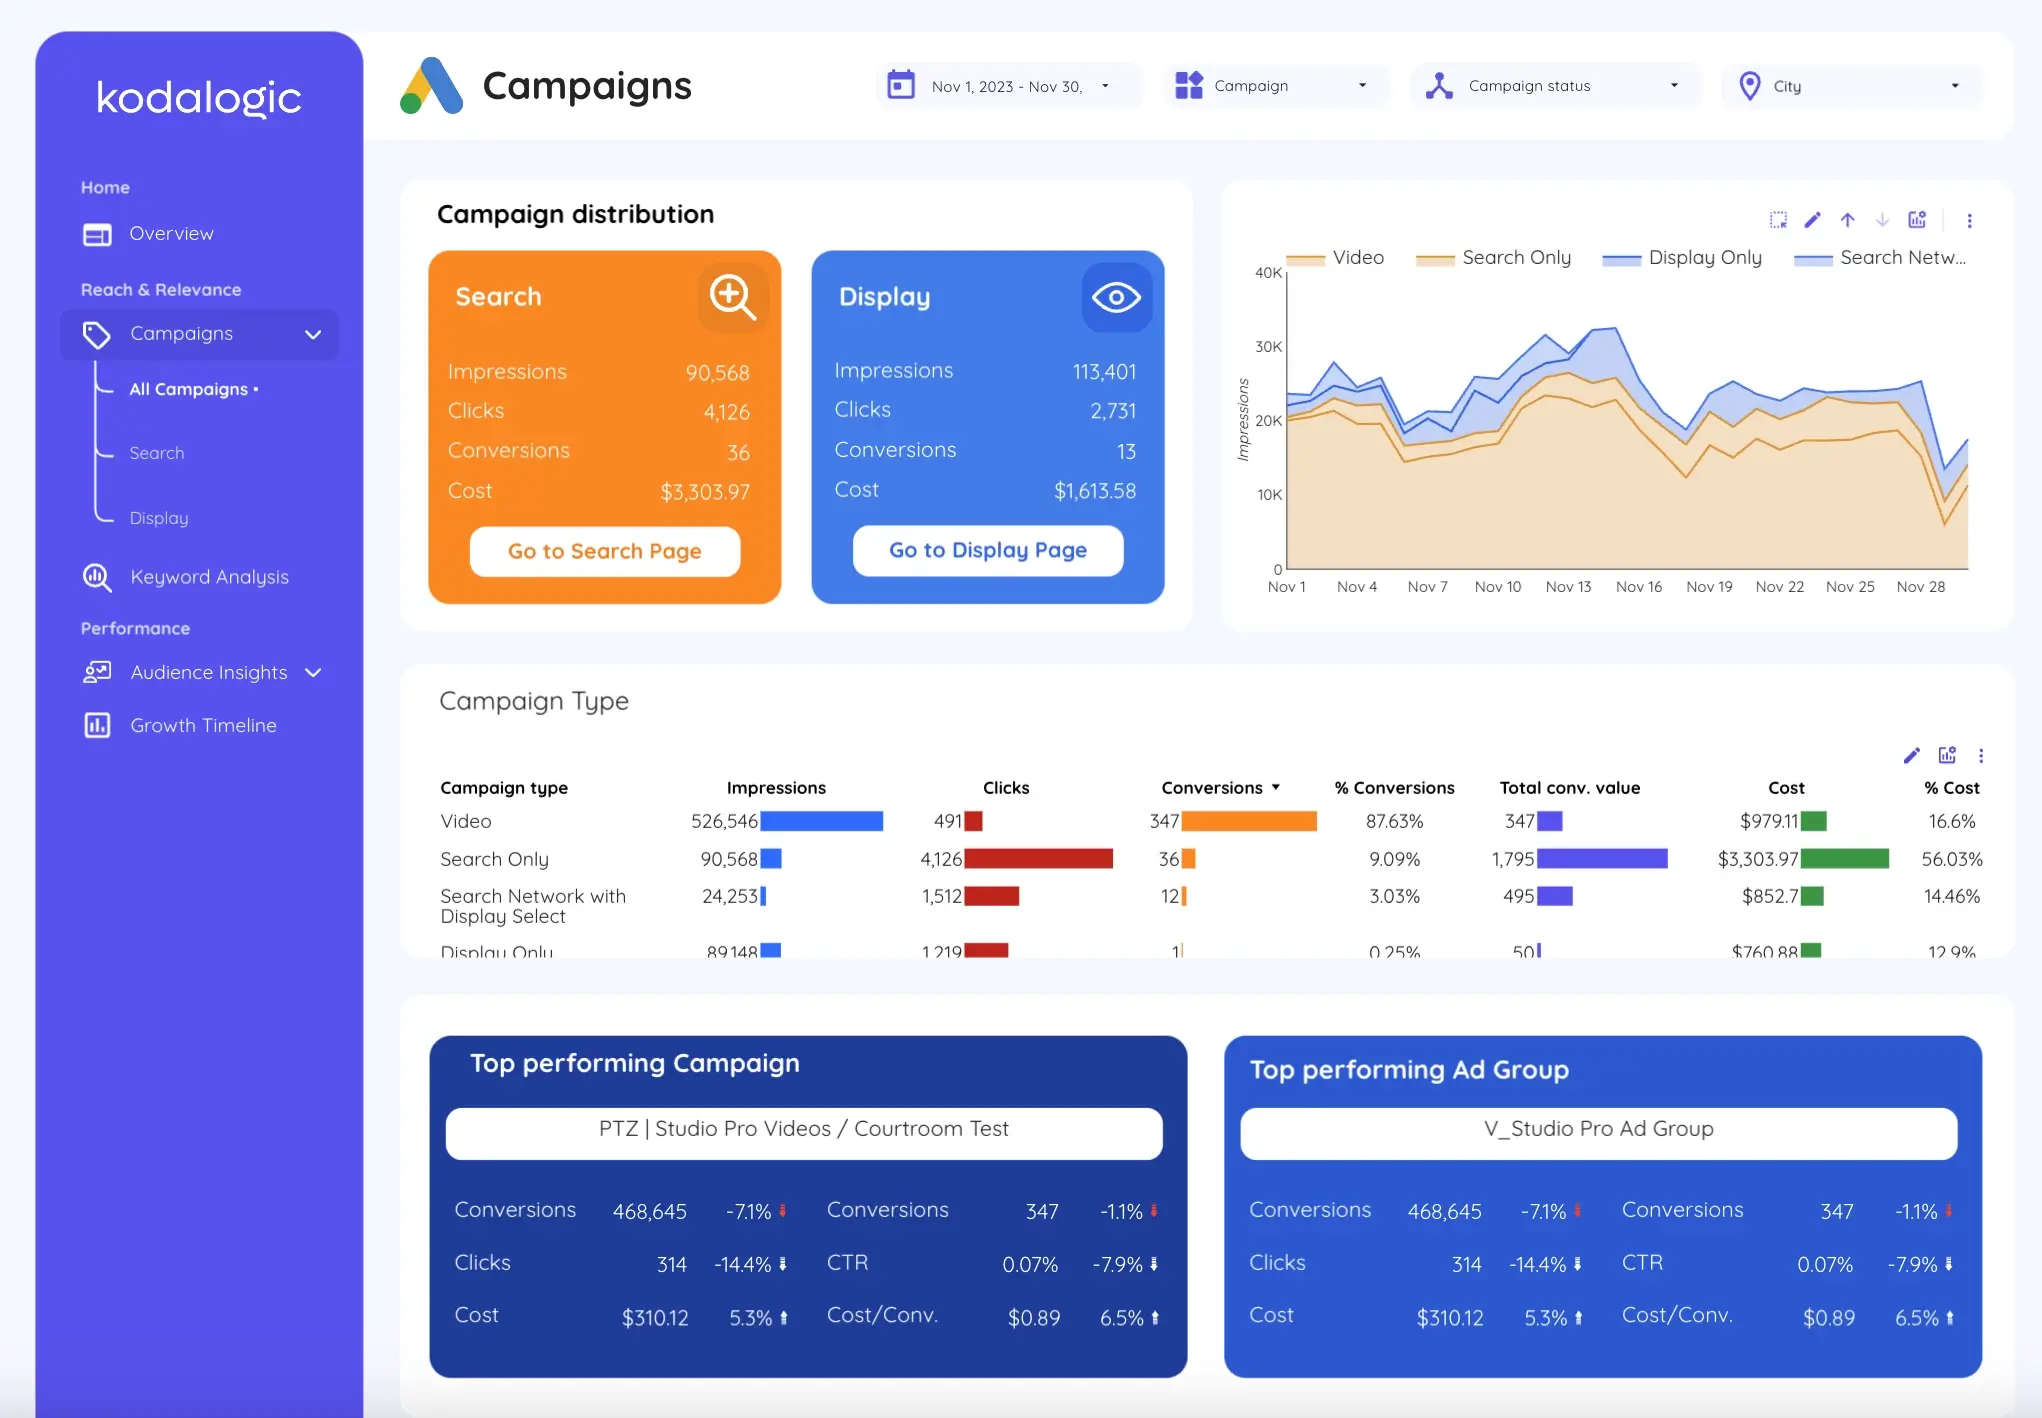 This is where you dive into the details. Visualize campaign-level data to identify what’s working and what needs to improve.
Key metrics:
- Impressions: how many times your ads were seen
- Clicks and CTR: how often users clicked
- Conversions and conversion rate
- ROAS (Return on Ad Spend): profit per dollar spent
Charts and tables work well here. You can compare campaigns side-by-side and see which ones deserve more budget.
Keyword Performance
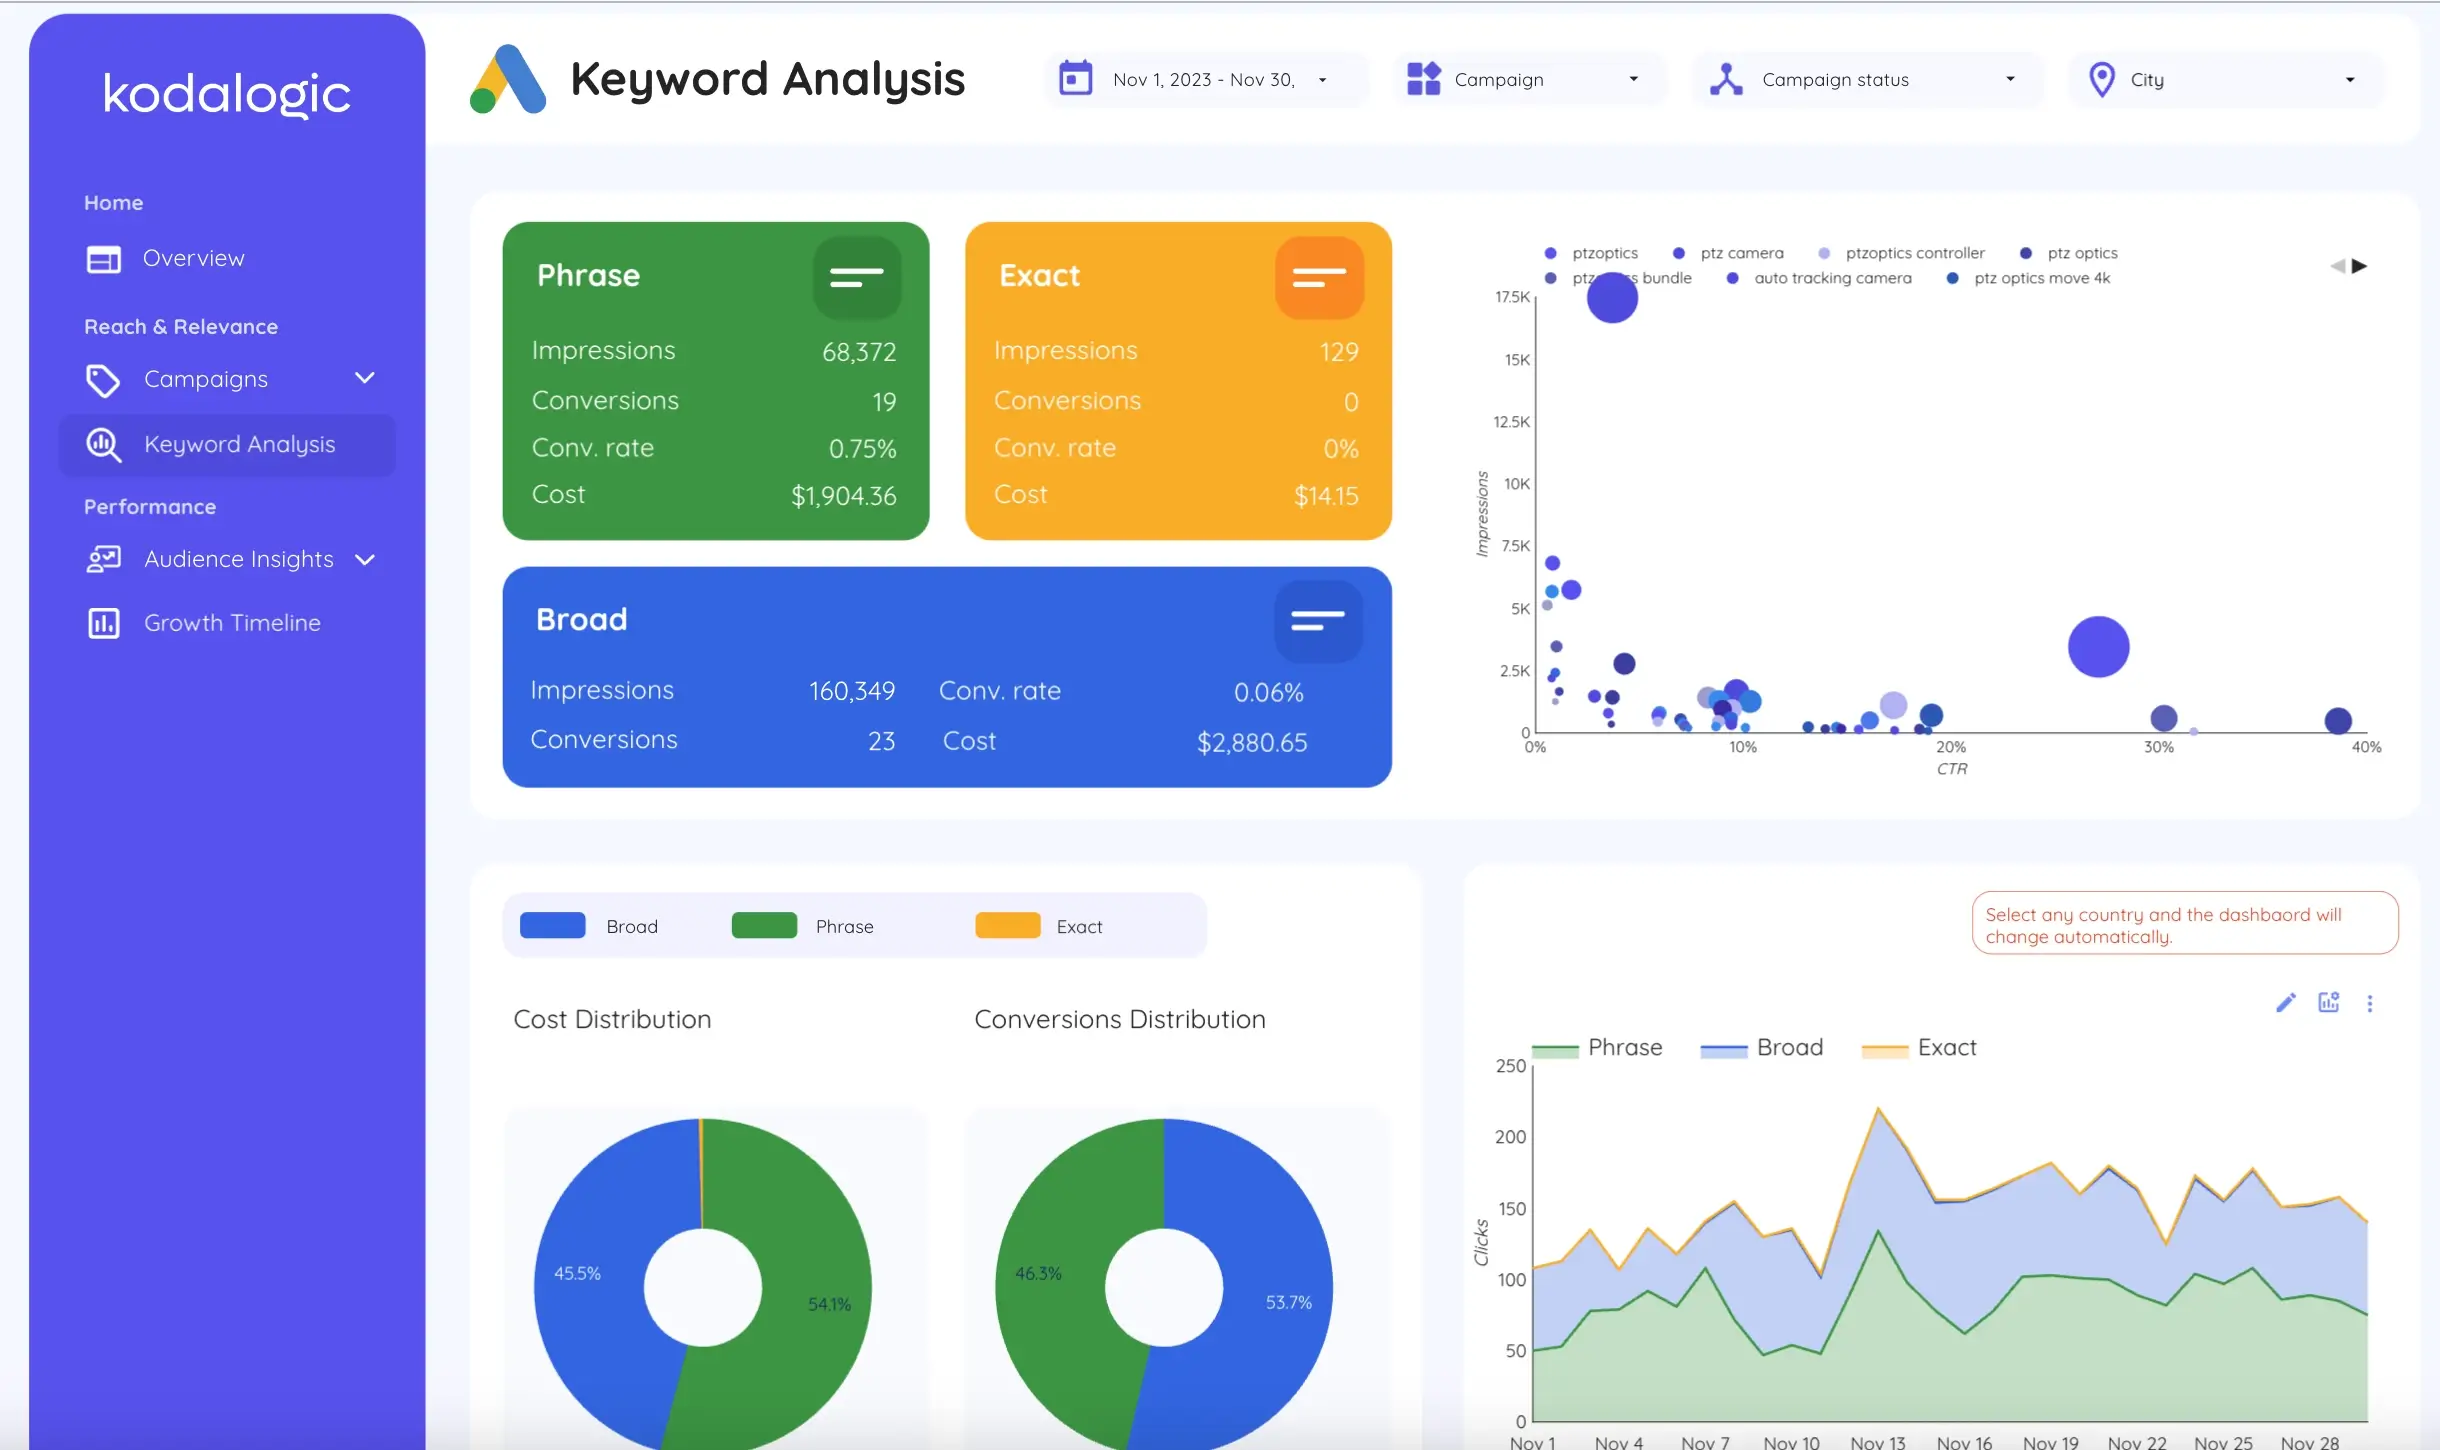 Include a dedicated section that highlights:
- Top-performing keywords
- Impressions and clicks
- CTR and average CPC
- Conversions and cost per conversion
This data helps you double down on what works and pause what doesn’t—turning insights into action quickly.
The structure of your advertising report will depend on your platform, audience, and goals. But most reports should include the following sections:
Audience Insights
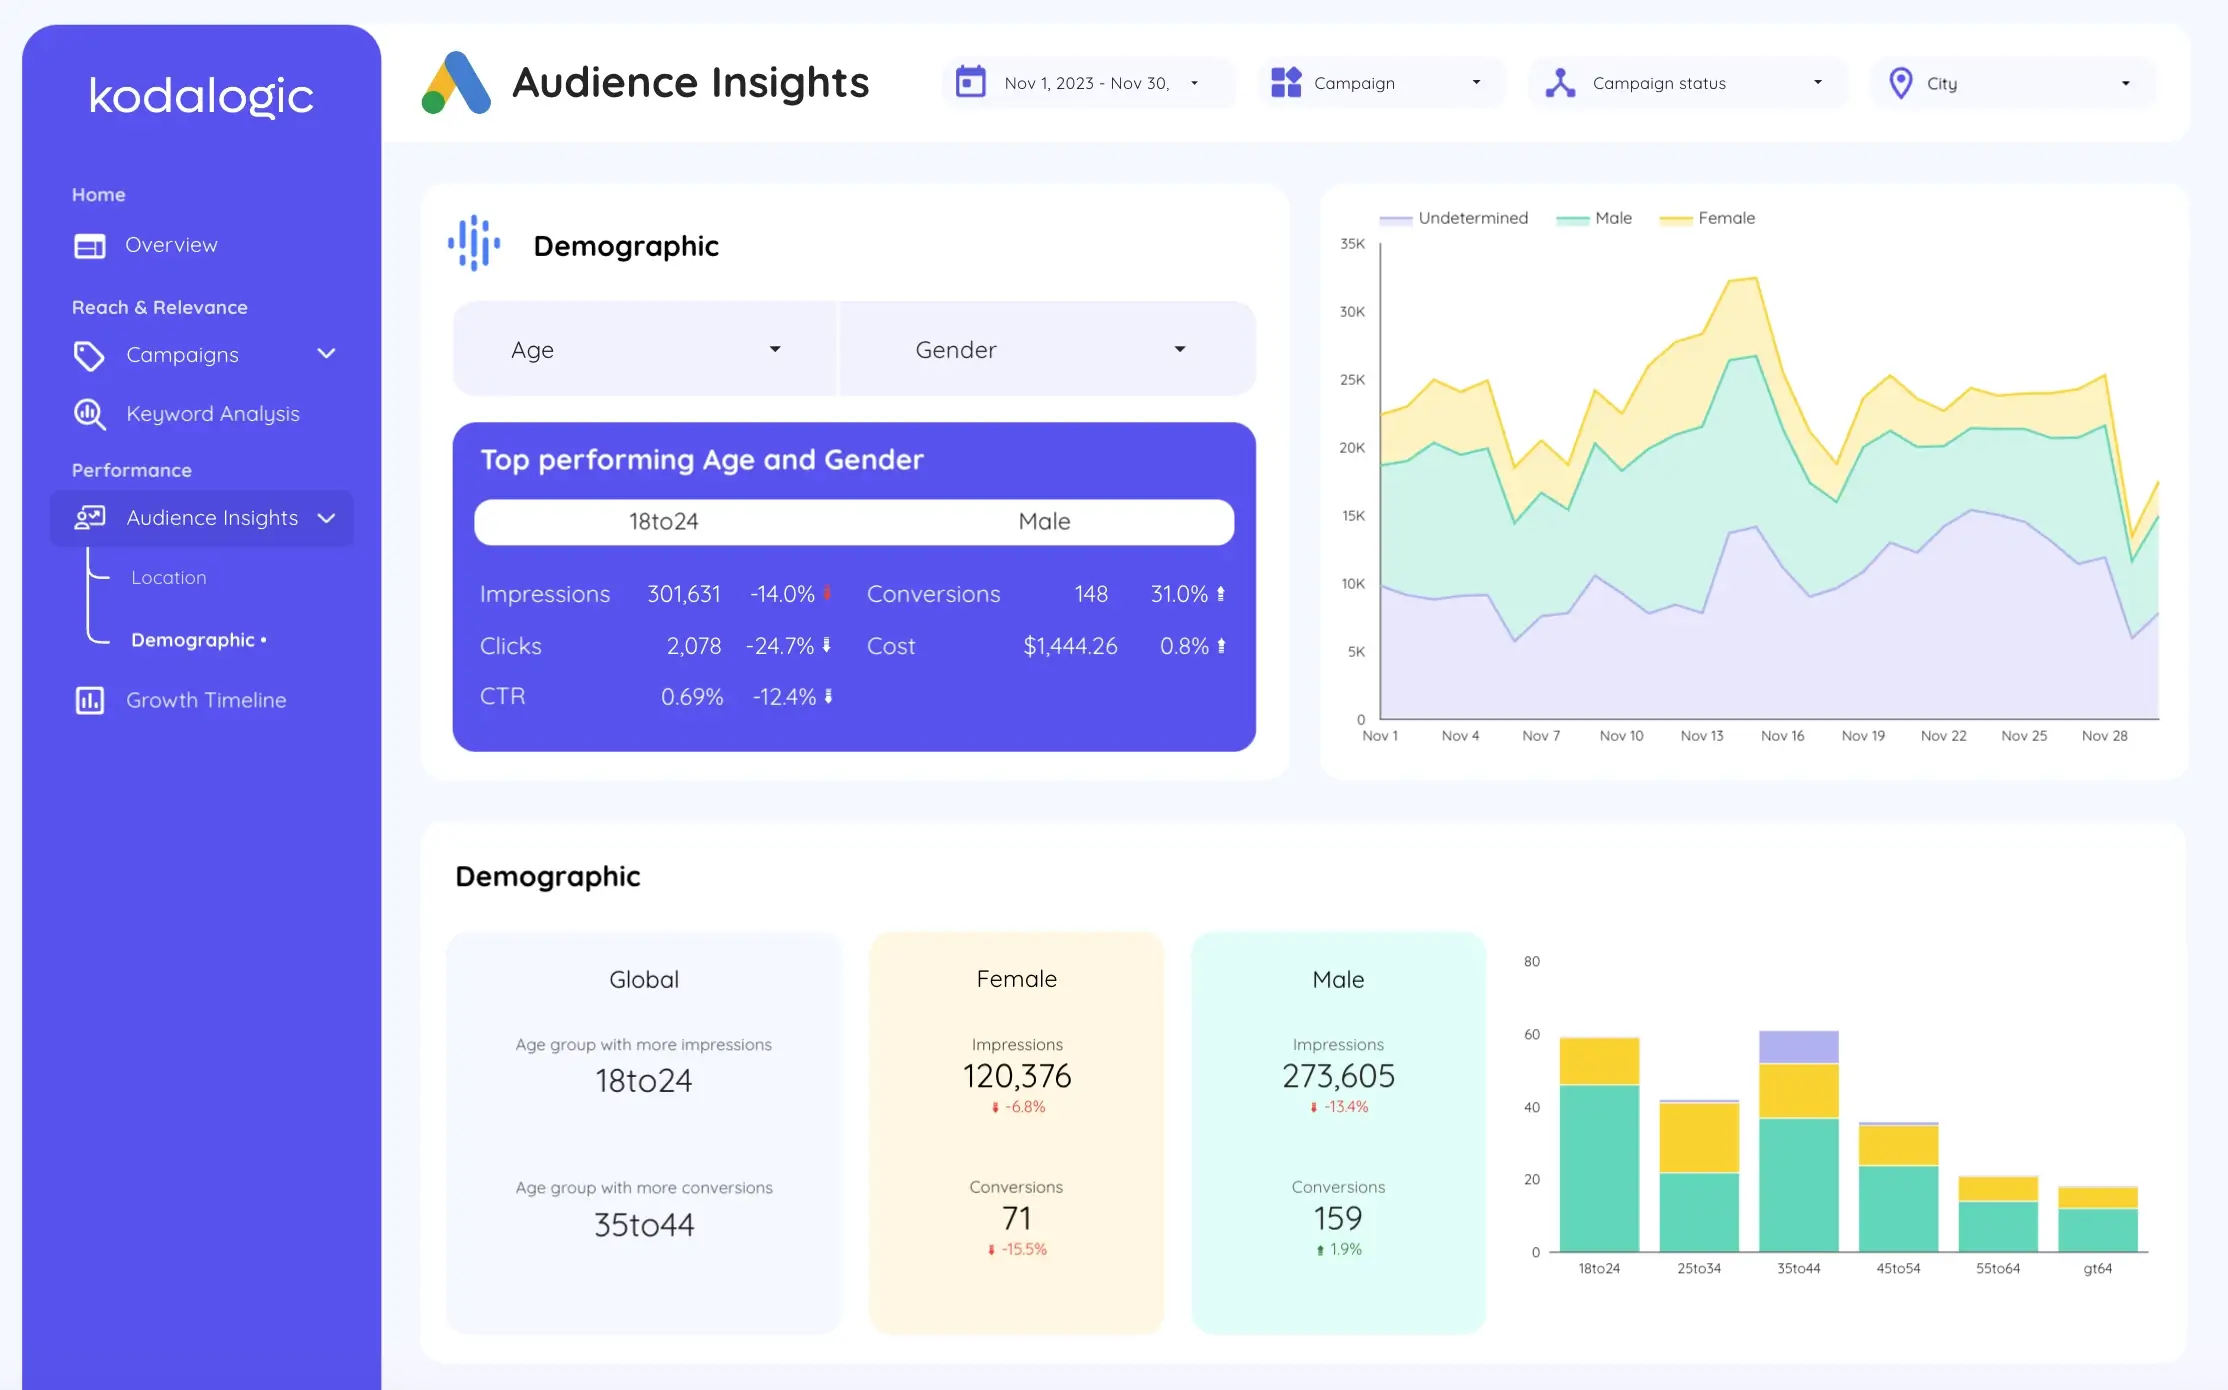 This section helps you understand who your ads are reaching and how those segments perform.
Break it down by:
- Demographics (age, gender)
- Geography (top countries or regions)
- Device (mobile vs. desktop)
- Engagement trends by segment
These insights help you refine targeting and messaging.
Time Period Analysis
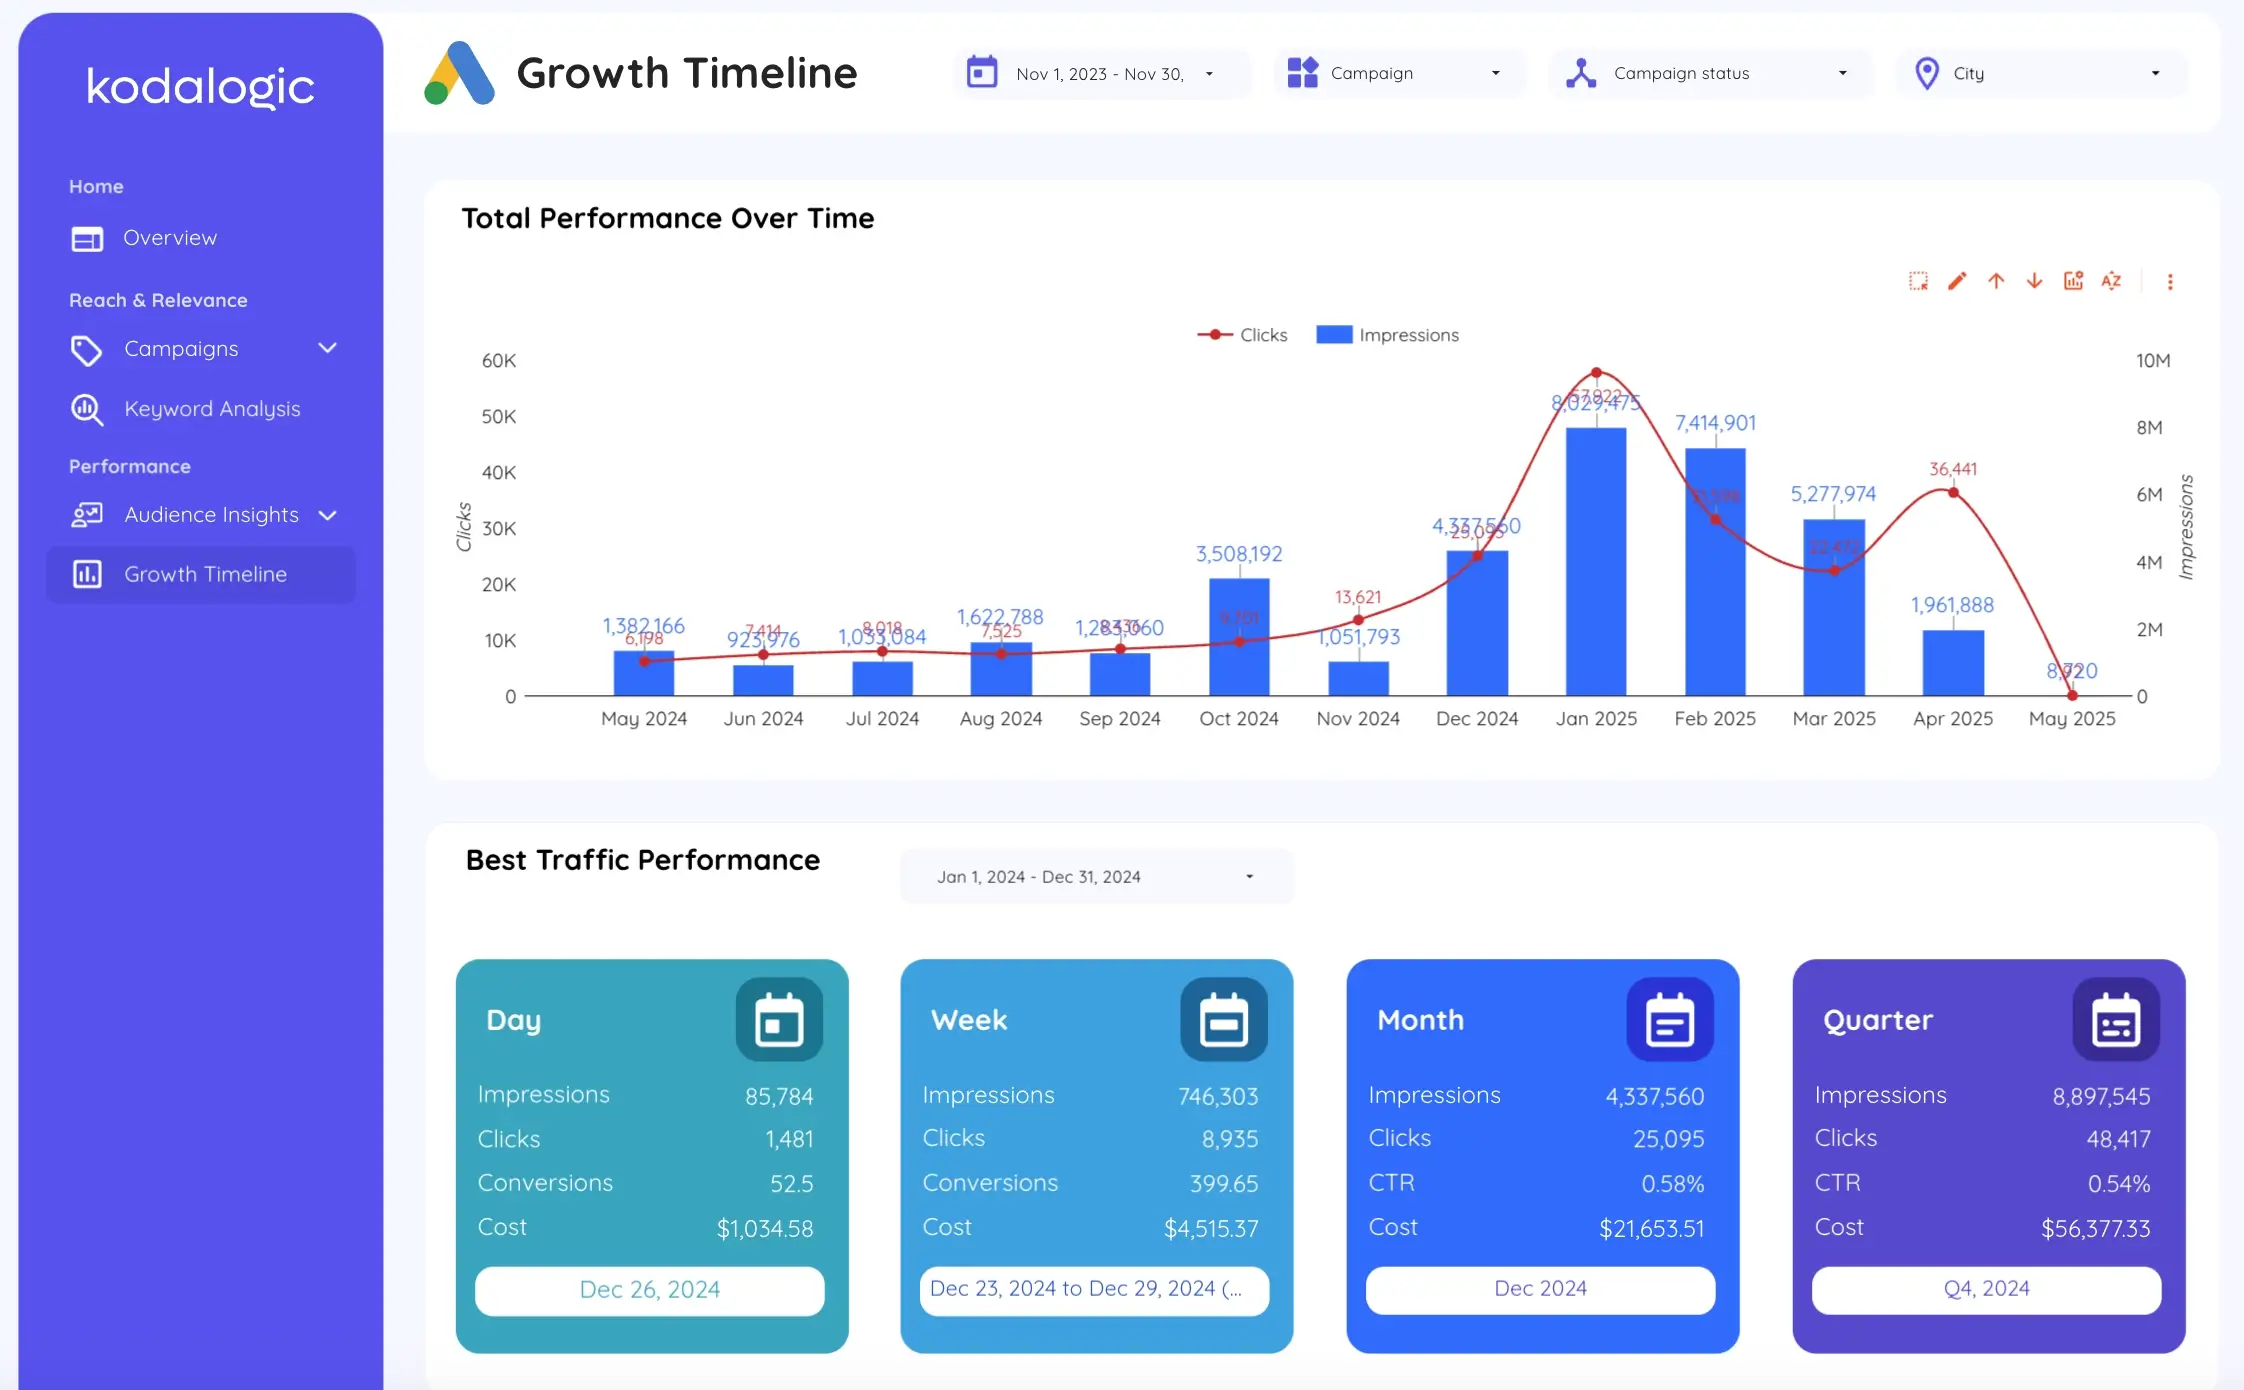
Analyzing data over time gives you valuable trends. Whether it’s week-over-week, month-over-month, or quarterly comparisons, this section highlights momentum.
Include:
- Historical performance trends
- Seasonal peaks or anomalies
- Period comparisons (e.g., last 30 days vs. previous 30 days)
This helps you make budget adjustments and spot opportunities.
Our Recommended Advertising Report: Google Ads Performance Template
 If you want one dashboard that delivers everything above, our Google Ads Looker Studio Template is the best place to start.
With this report, you can:
- Monitor campaign-level metrics in real time
- Track CTR, ROAS, cost per conversion, and more
- Analyze top-performing keywords and audiences
- Understand ad performance across regions and devices
It’s modular, fast, and easy to schedule for automated delivery.
Ideal for marketers, agencies, and teams who want clean, actionable insights without relying on external platforms.
✨ Highlights from the Kodalogic Google Ads Dashboard
| Section | What You’ll See |
|---|---|
| Keyword Performance | Top search terms with impressions, CPC, and conversions. |
| Campaign Insights | CTR, ROAS, cost, and results per campaign, with auto-highlighted top performers. |
| Geographic & Device | Location and device breakdowns to spot where and how users engage best. |
| Audience Demographics | Age and gender insights that reveal which segments drive the most conversions. |
Ready to Build Smarter Advertising Reports?
At Kodalogic, we help marketers and agencies eliminate repetitive reporting with dashboards that are:
✅ Built in Looker Studio
✅ Connected to real-time data
✅ Easy to automate and customize
You’ll save hours each month, improve decision-making, and deliver clear reports that actually drive action.
Explore our ad reporting templates now
No tools. No code. Just results.