15 of November of 2025
Google Search Console Looker Studio: Track Keyword Rankings

Isaac Correa
Looker Studio Templates
SEO & Marketing Dashboards
Connect Google Search Console to Looker Studio. Track rankings, impressions, and clicks in one dashboard. Real-time SEO insights, automated reporting.
Google Search Console Looker Studio: See Your Rankings and Optimize Faster
Your website ranks for hundreds of keywords. Google Search Console shows which ones drive clicks. But here's the frustrating reality most SEO professionals face every single day: you're staring at dozens of separate reports, jumping between query data and page data, manually exporting numbers just to understand how your website actually performs in search results.
Your team needs clear answers about which keywords matter most. Your clients want proof that your SEO work is delivering results. Your strategy depends on understanding what Google Search Console is actually telling you about your ranking position and search traffic.
Most SEO dashboards fail because they treat Search Console data as one-dimensional. Your best SEO dashboard needs to show you the complete picture of your search visibility.
Why Search Console Reporting Still Takes Hours
Google Search Console provides invaluable insights about your website's performance in search results, yet most teams struggle to make sense of the raw data. Search Console shows what happens in Google search results: impressions, clicks, the queries that bring people to your site, and your average ranking position. Yet extracting this information and turning it into something meaningful requires endless manual work.
Consider what happens now in most organizations. You log into Search Console. You navigate to the Performance report. You see aggregate numbers that hide the detail you actually need. To understand which specific keywords are worth investing in, you need to drill down page by page, query by query. To track performance over time, you export data. To show clients your rankings, you manually compile spreadsheets.
By the time you have answers, the data is already outdated and you've spent hours that could have gone toward actual optimization.
The core problem isn't that Search Console lacks data. The problem is that Search Console's interface wasn't designed for deep analysis or beautiful reporting. It shows you what's happening in search, but not in a way that drives strategic decisions or client conversations.
Transforming raw Search Console data into actionable SEO insights helps you understand your organic performance in a visual, actionable way. Whether you're managing a single site or multiple client properties, connecting your Search Console data to a visualization tool changes everything about how you work.
What Modern SEO Reporting Actually Requires
Building an effective SEO dashboard means understanding that different metrics answer different questions. Your sales team needs to know whether organic search is growing. Your content team needs to know which topics perform best. Your technical SEO specialist needs to know if crawl or indexation issues are affecting rankings.
Every comprehensive SEO dashboard focused on Search Console needs to answer these fundamental questions:
Which search queries bring the most qualified traffic to our site, and what's our current ranking position for each? Understanding which keywords drive clicks and impressions tells you where your ranking efforts have been successful and where opportunities exist. This is your foundation for SEO strategy.
Are our rankings improving or declining over time? Historical comparison reveals whether your optimization efforts are moving the needle or if market conditions are shifting. Tracking ranking positions week over week and month over month shows progress that matters to clients.
Which of our pages are getting impressions but few clicks, indicating title or description optimization opportunities? Sometimes you rank high but users don't click your result. This signals clear opportunity: improve your title tags and meta descriptions to increase click through rate from your current position.
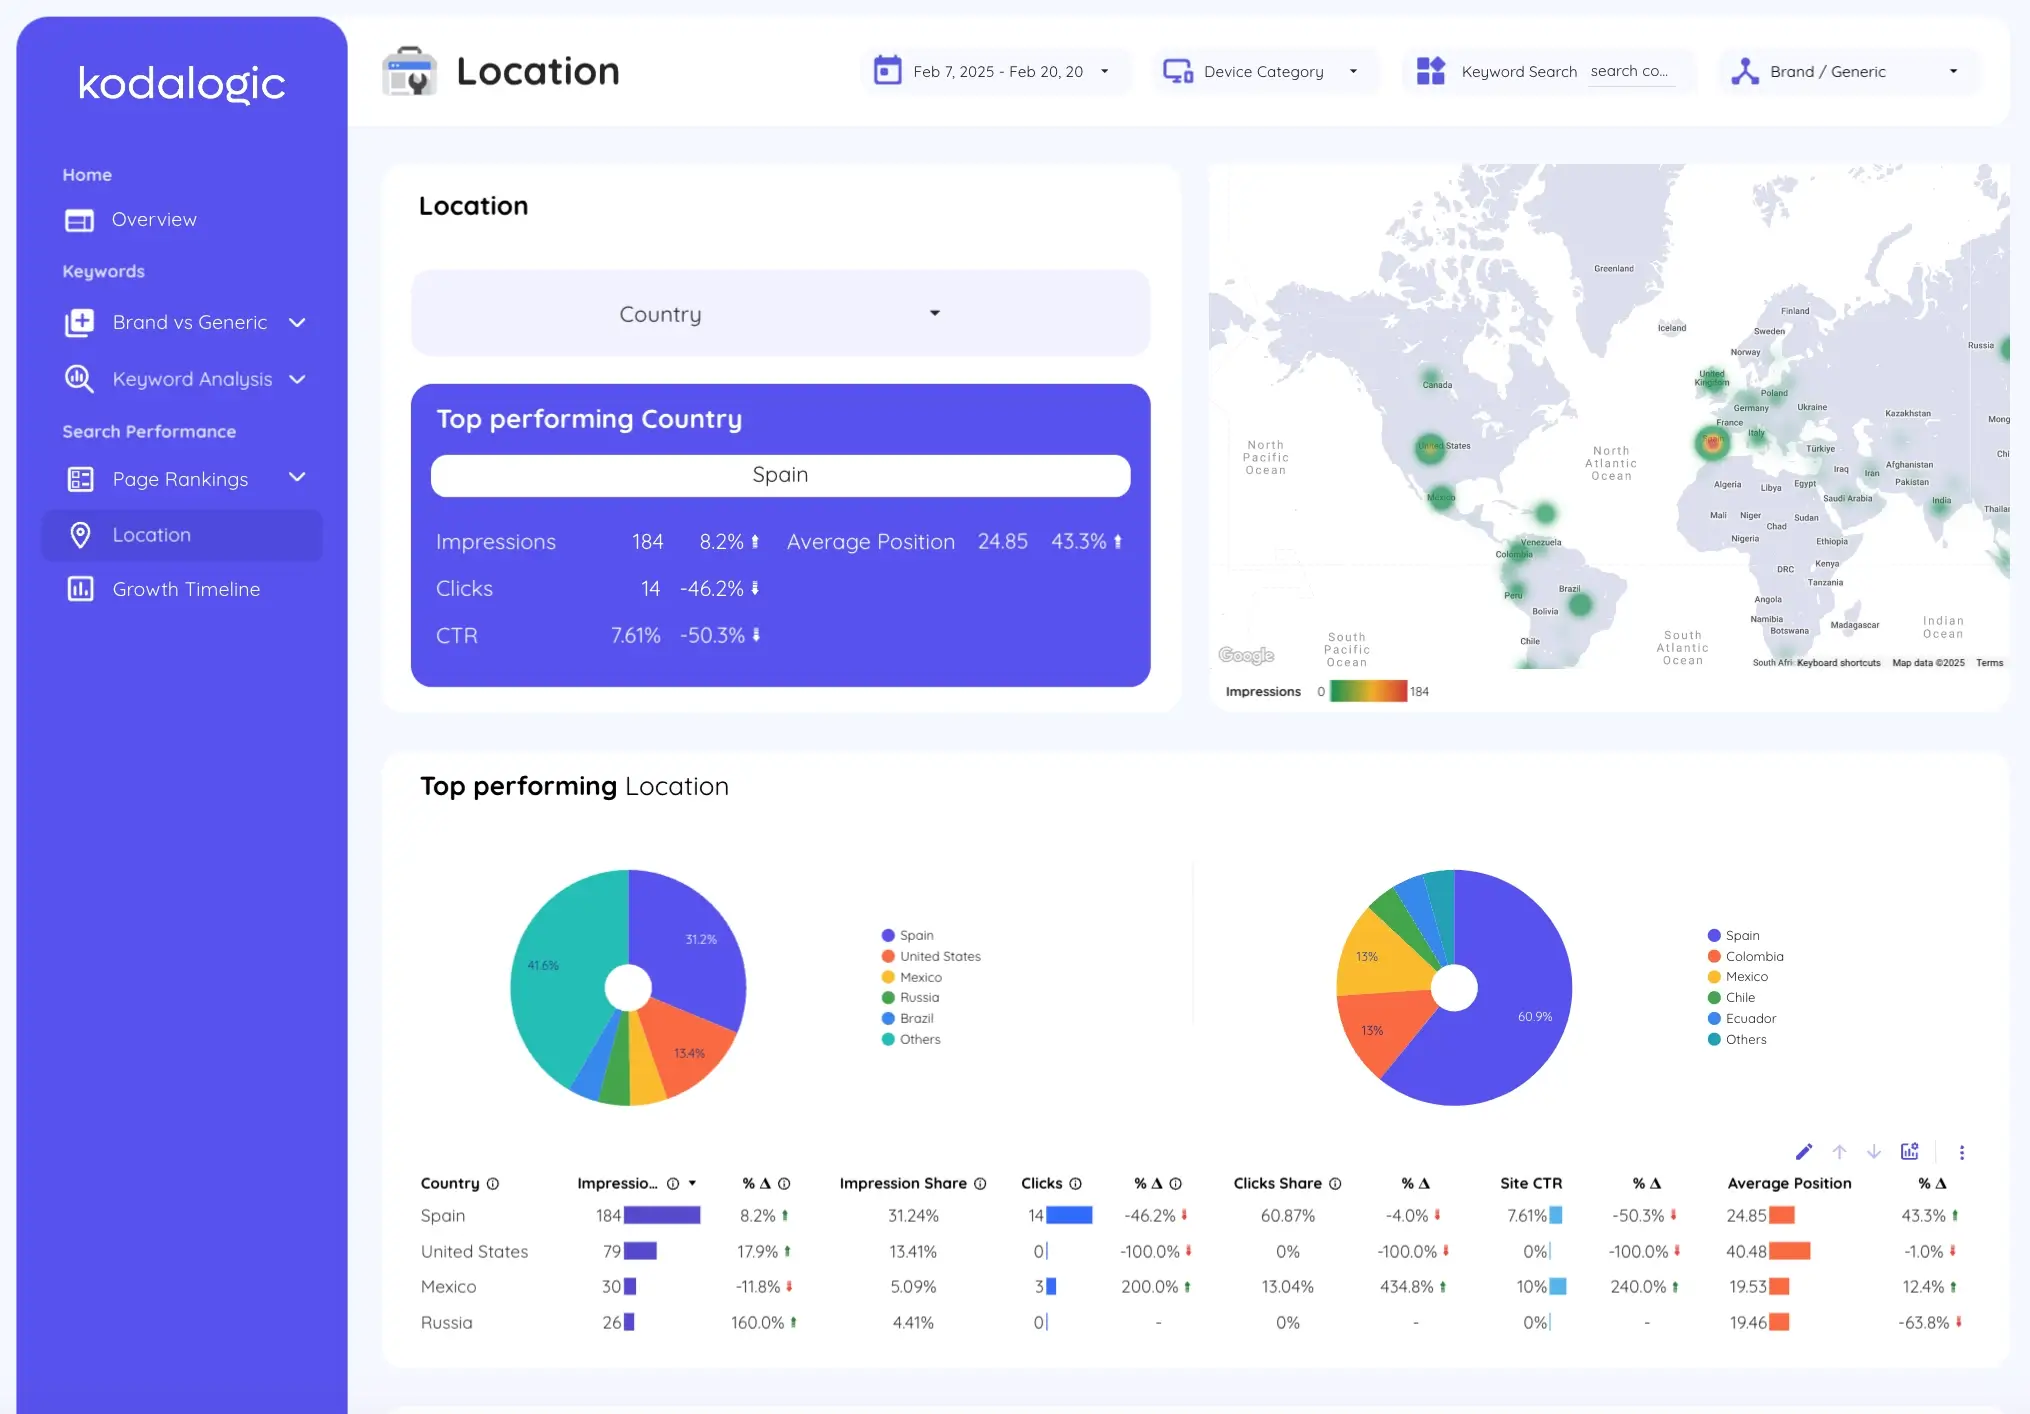
How does our search visibility differ across geographic markets, devices, or search types? Understanding these segments reveals where your strengths lie and where you might focus next. Mobile rankings might differ from desktop. Organic visibility in one country might dramatically differ from another. These insights shape targeted optimization strategies.
Which high-ranking keywords could be worth investing more in? Some keywords rank in positions five through ten with strong impressions but haven't quite broken through to position three or better. These represent quick wins where small improvements could yield significant traffic increases.
Building a dashboard around these questions transforms how SEO teams operate. Instead of spending hours compiling reports from Search Console, you're analyzing performance in real time. Instead of explaining why rankings matter, your dashboard shows exactly which keywords are converting clicks.
The Technical Reality of Managing Search Console Data
Search Console's native interface provides comprehensive data, yet extracting it requires understanding how the data structures work. Query data shows search terms. Page data shows landing pages. But combining these perspectives requires manual configuration or exporting to spreadsheets.
Looker Studio offers the solution by connecting directly to Search Console's data. You gain the ability to visualize your SEO performance through charts, graphs, and tables that reveal trends and patterns instantly. Instead of clicking through multiple reports in Search Console, you're looking at a unified dashboard where all your ranking data tells a coherent story.
The native Google connector provides direct access to Search Console data completely free. This connector works perfectly for individual sites and basic SEO dashboards. You can visualize metrics like impressions, clicks, CTR, and average position all in one place.
For agencies managing multiple client properties, specialized connectors offer additional power. These connectors gather data from multiple Search Console accounts simultaneously, allowing you to consolidate data from all your clients into unified reports. You can merge Search Console with other data sources or build white-labeled dashboards that show exactly what each client needs to see.
The distinction matters because your needs determine which approach works best. If you manage your own website, the free native connector solves your problem. If you manage dozens of client properties, you need scalability that the native connector can't provide alone.
The Search Console Dashboard Framework That Delivers Results
An effective SEO dashboard organizes Search Console data around how optimization decisions actually get made. Here's how professionals structure them.
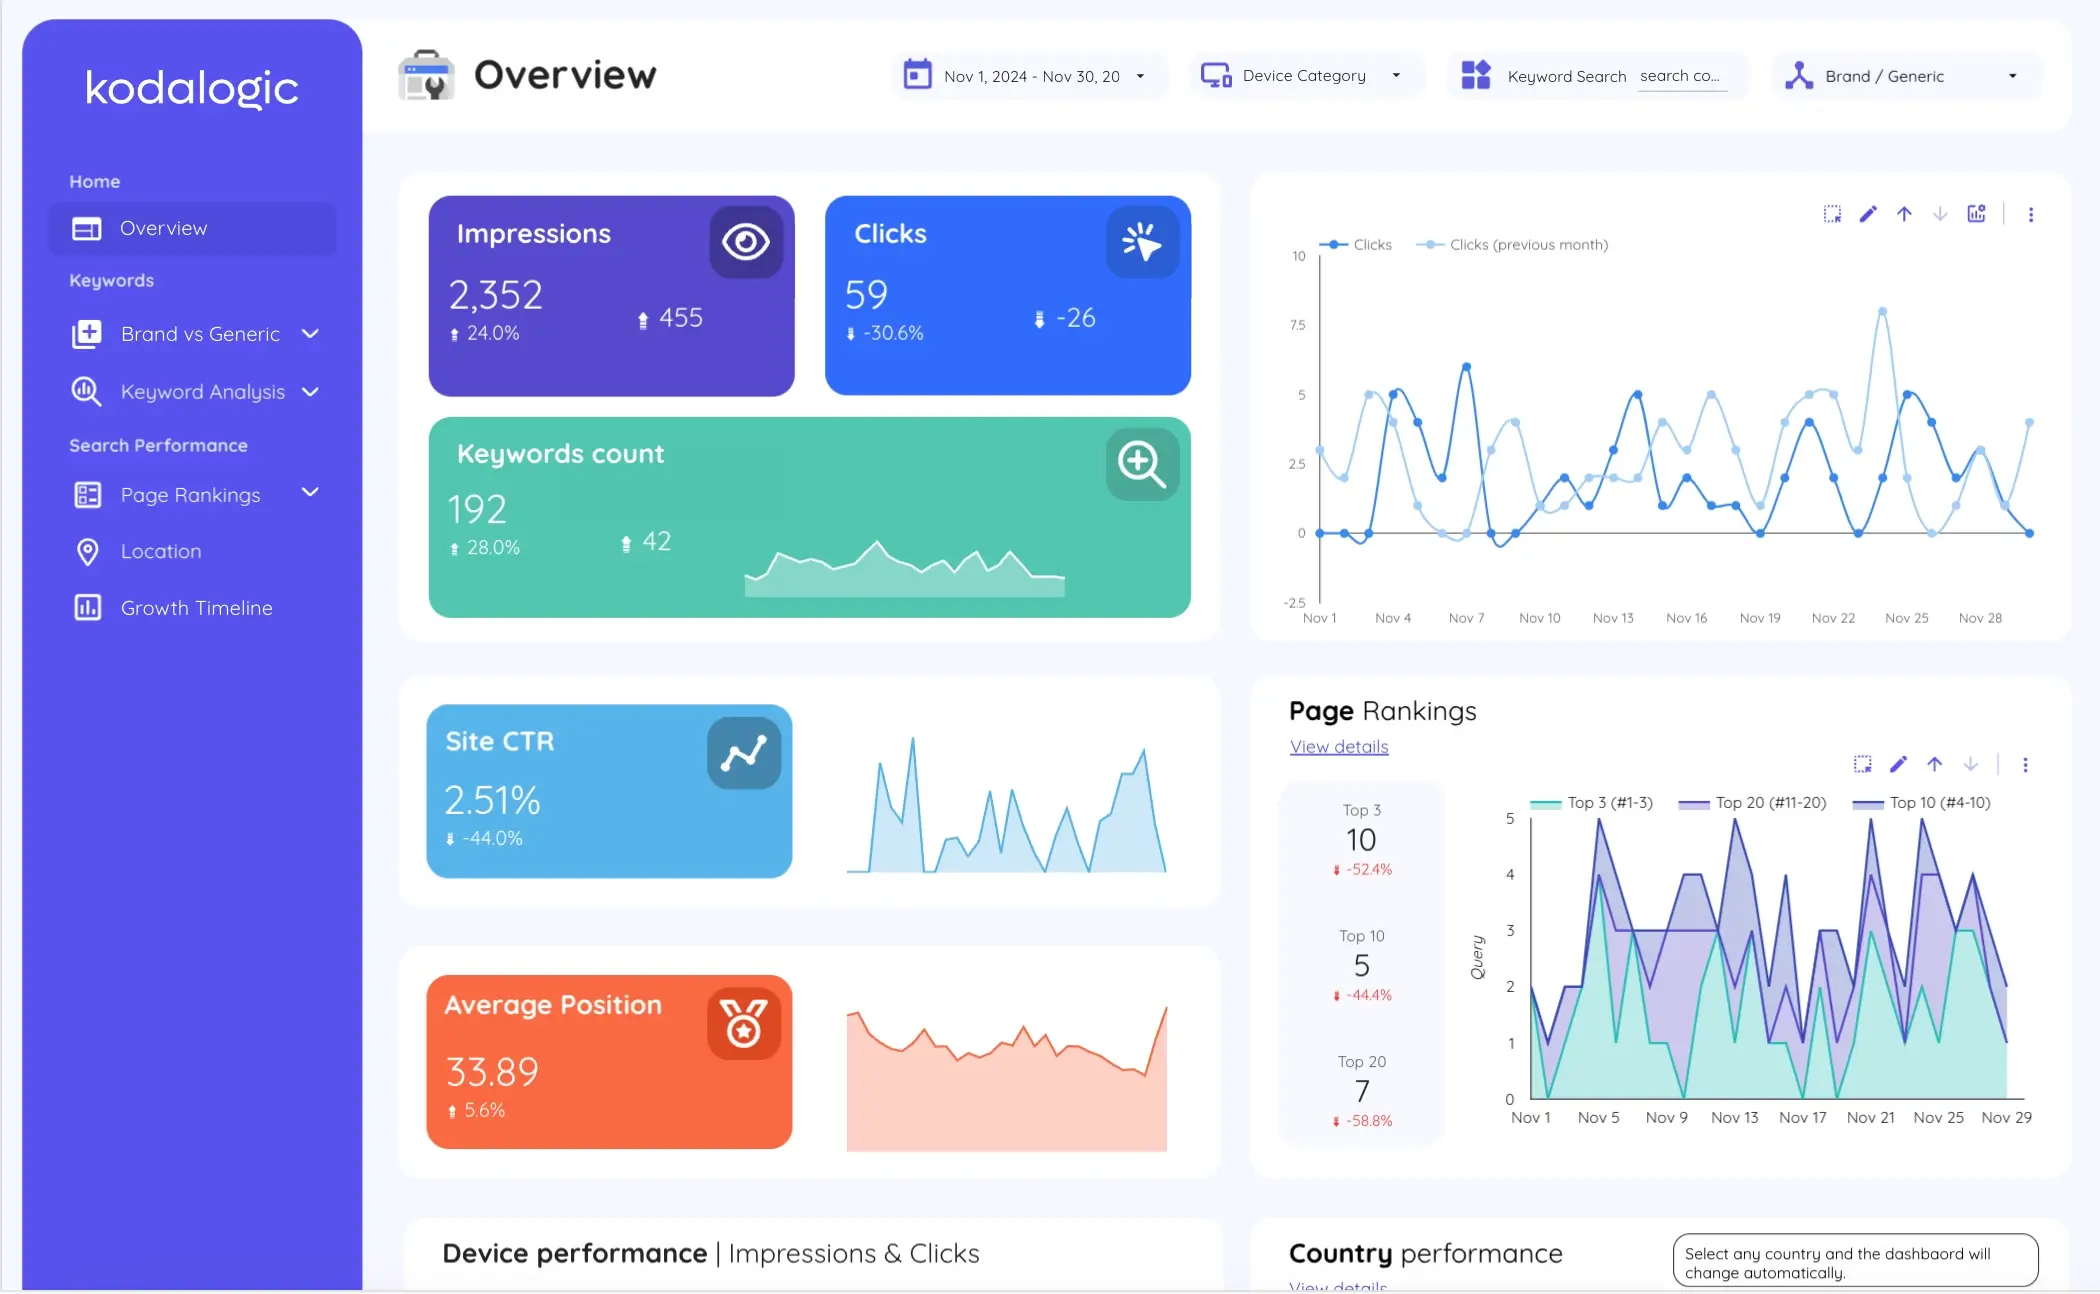
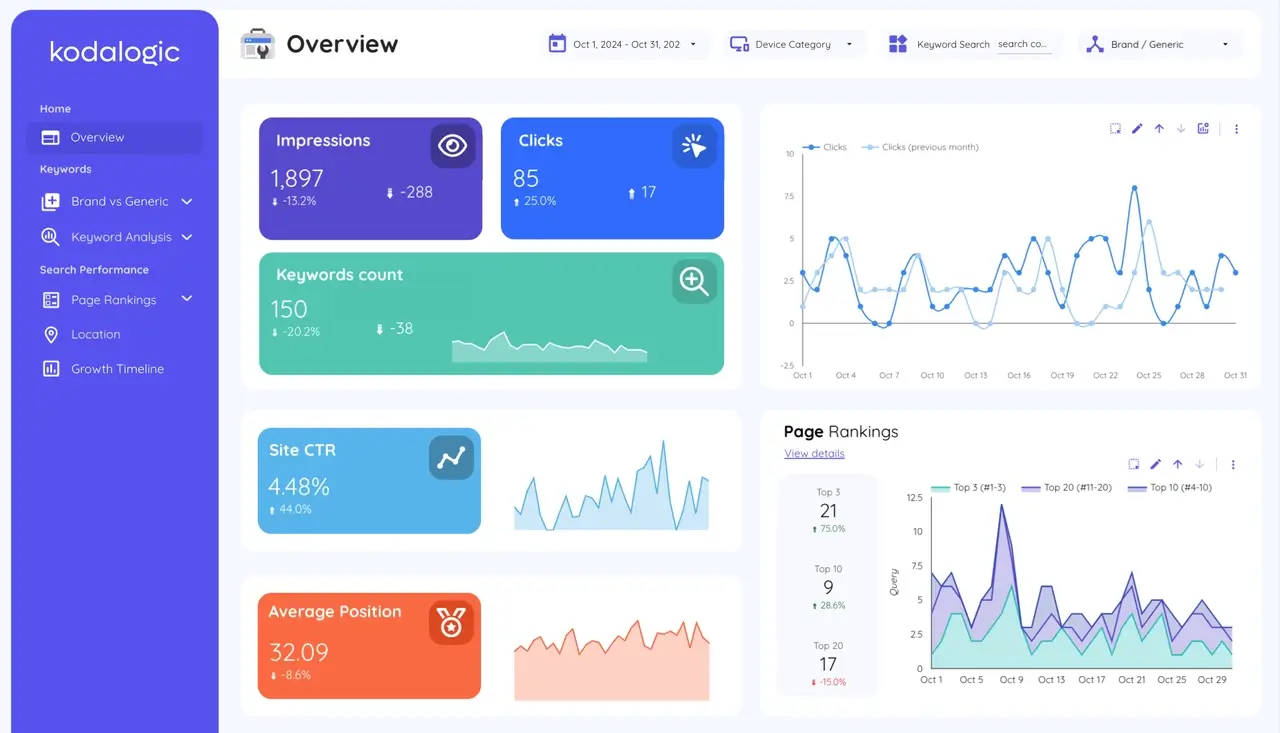
The overview section provides immediate clarity on overall search performance. Total impressions across all keywords appear at the top. Total clicks and overall click through rate give you a snapshot of whether search traffic is healthy. You see at a glance whether impressions are growing or declining, whether you're attracting more clicks, and whether your CTR is improving. This section answers the executive question: is our SEO working?
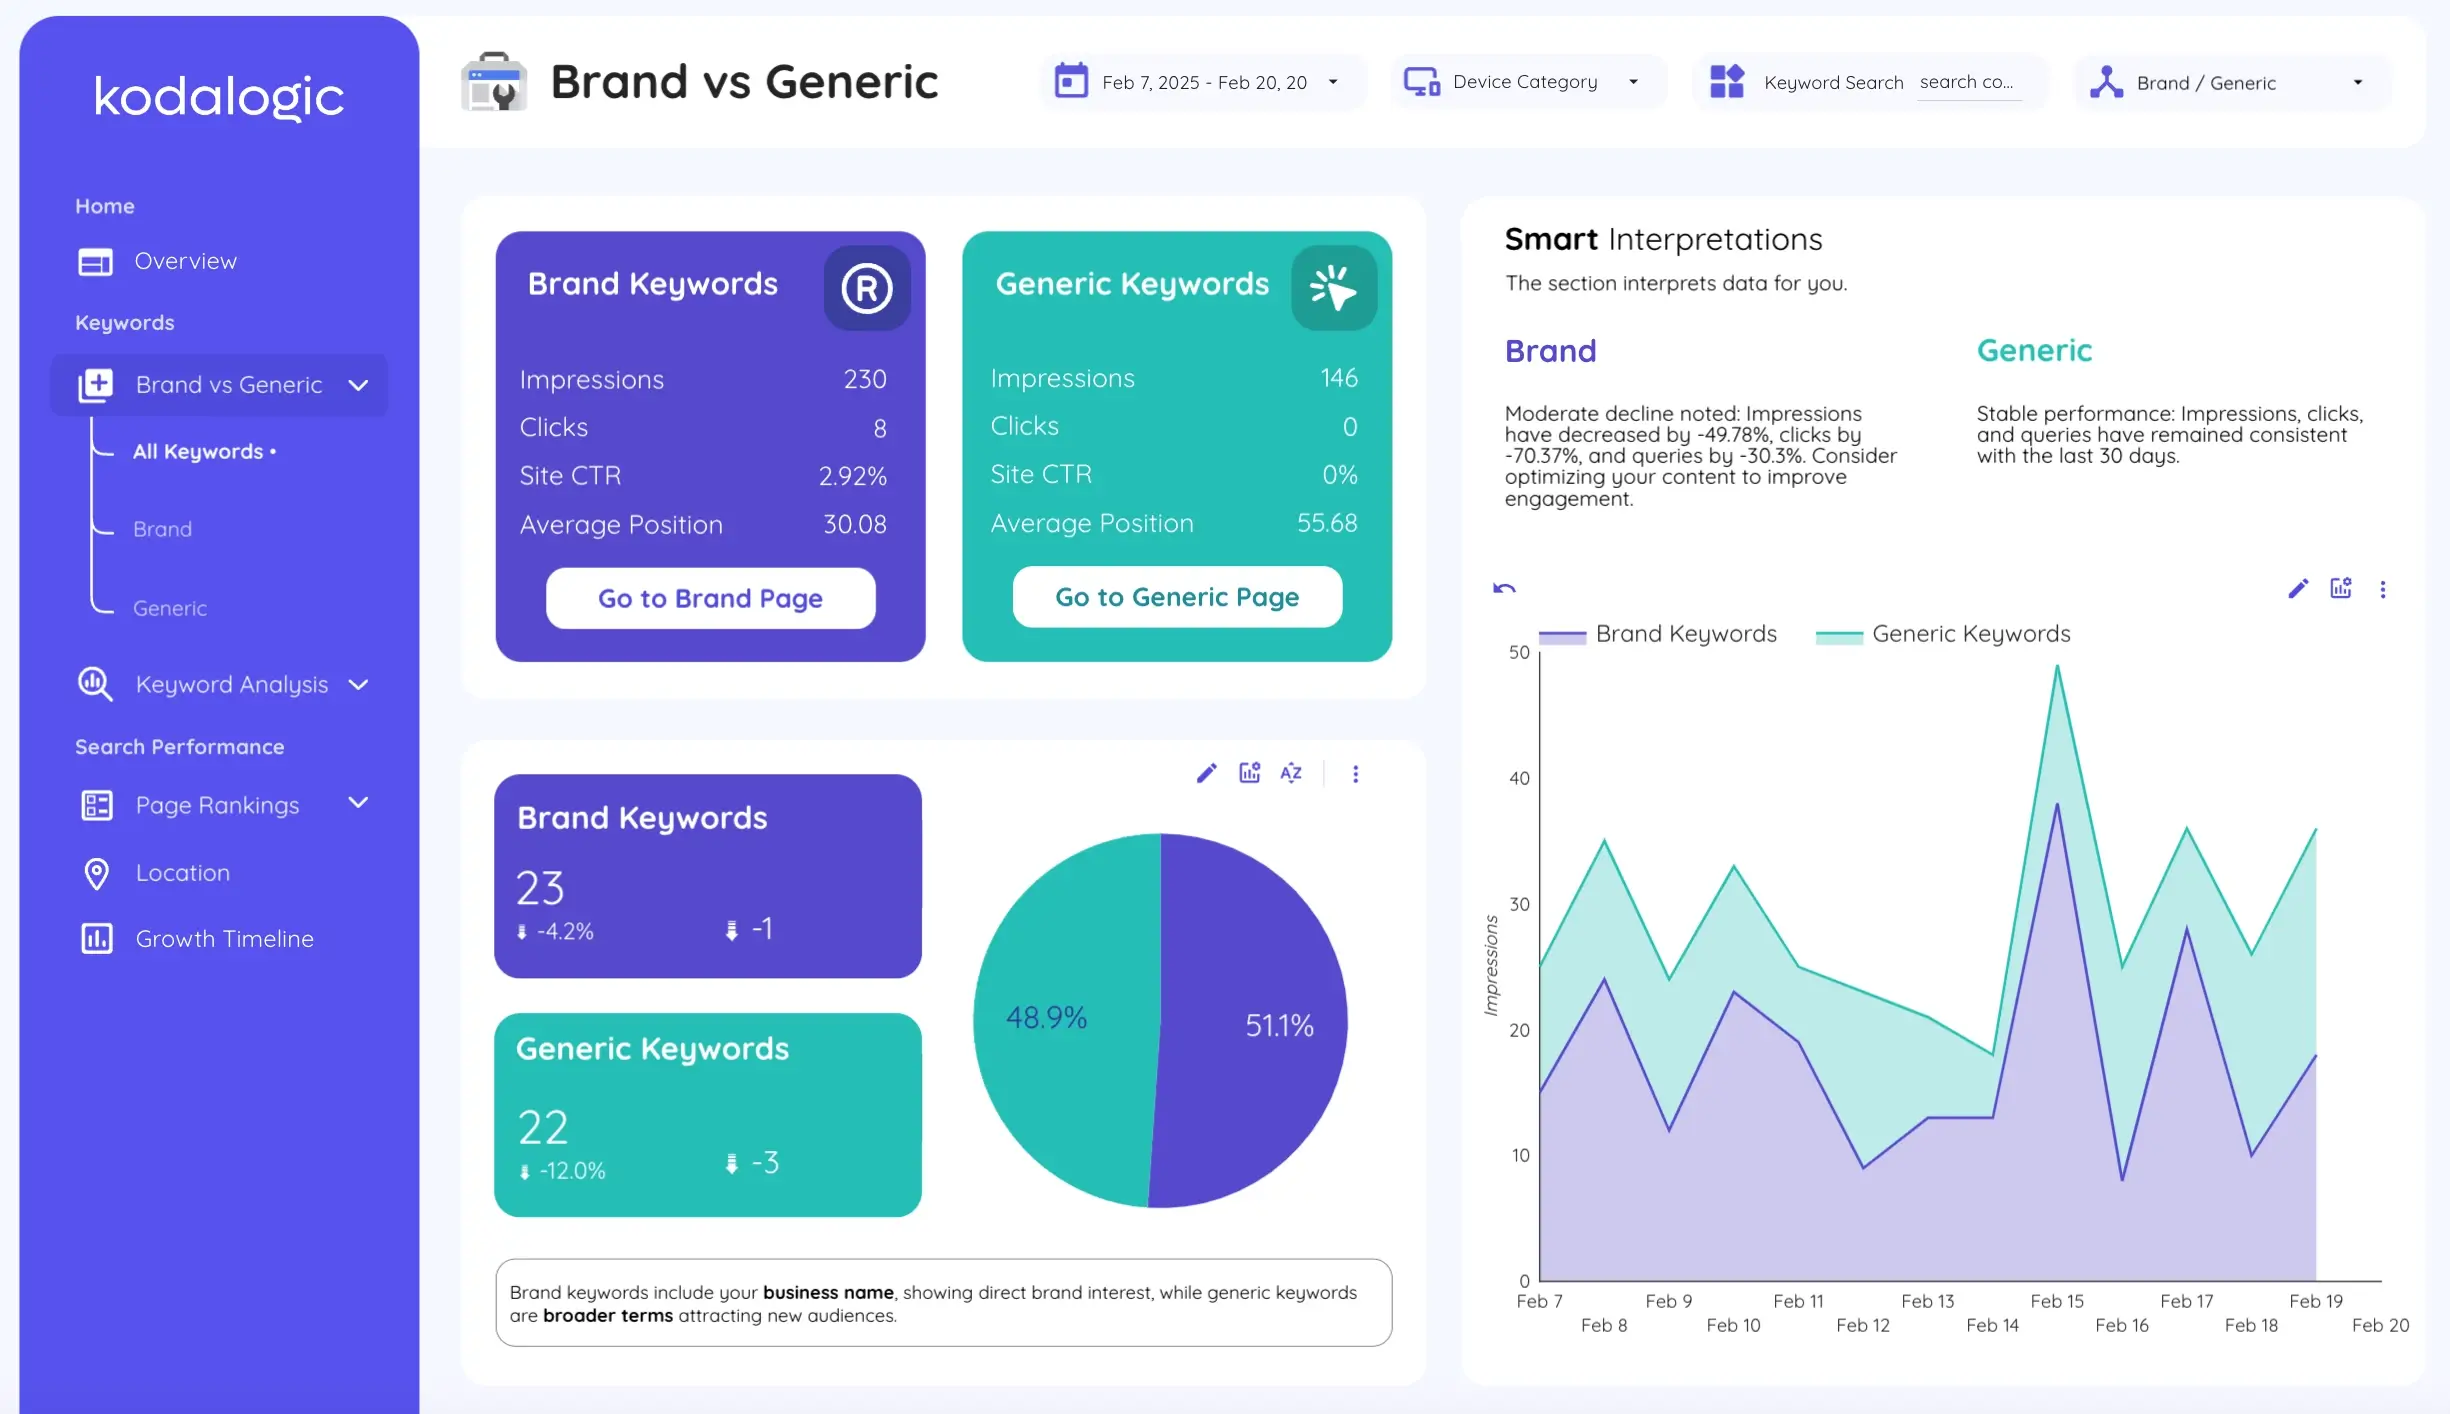
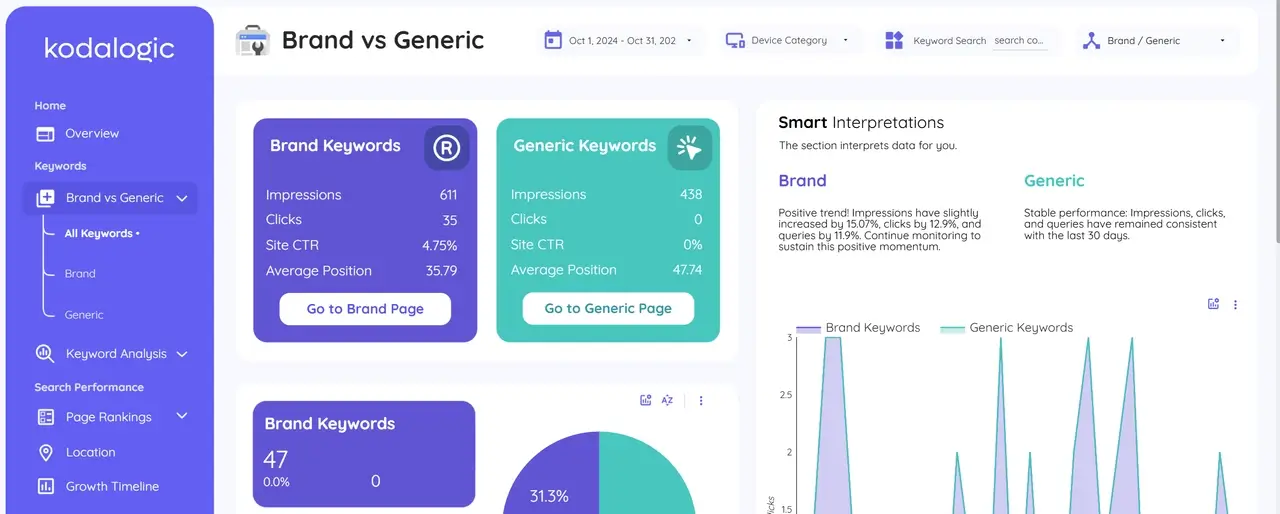
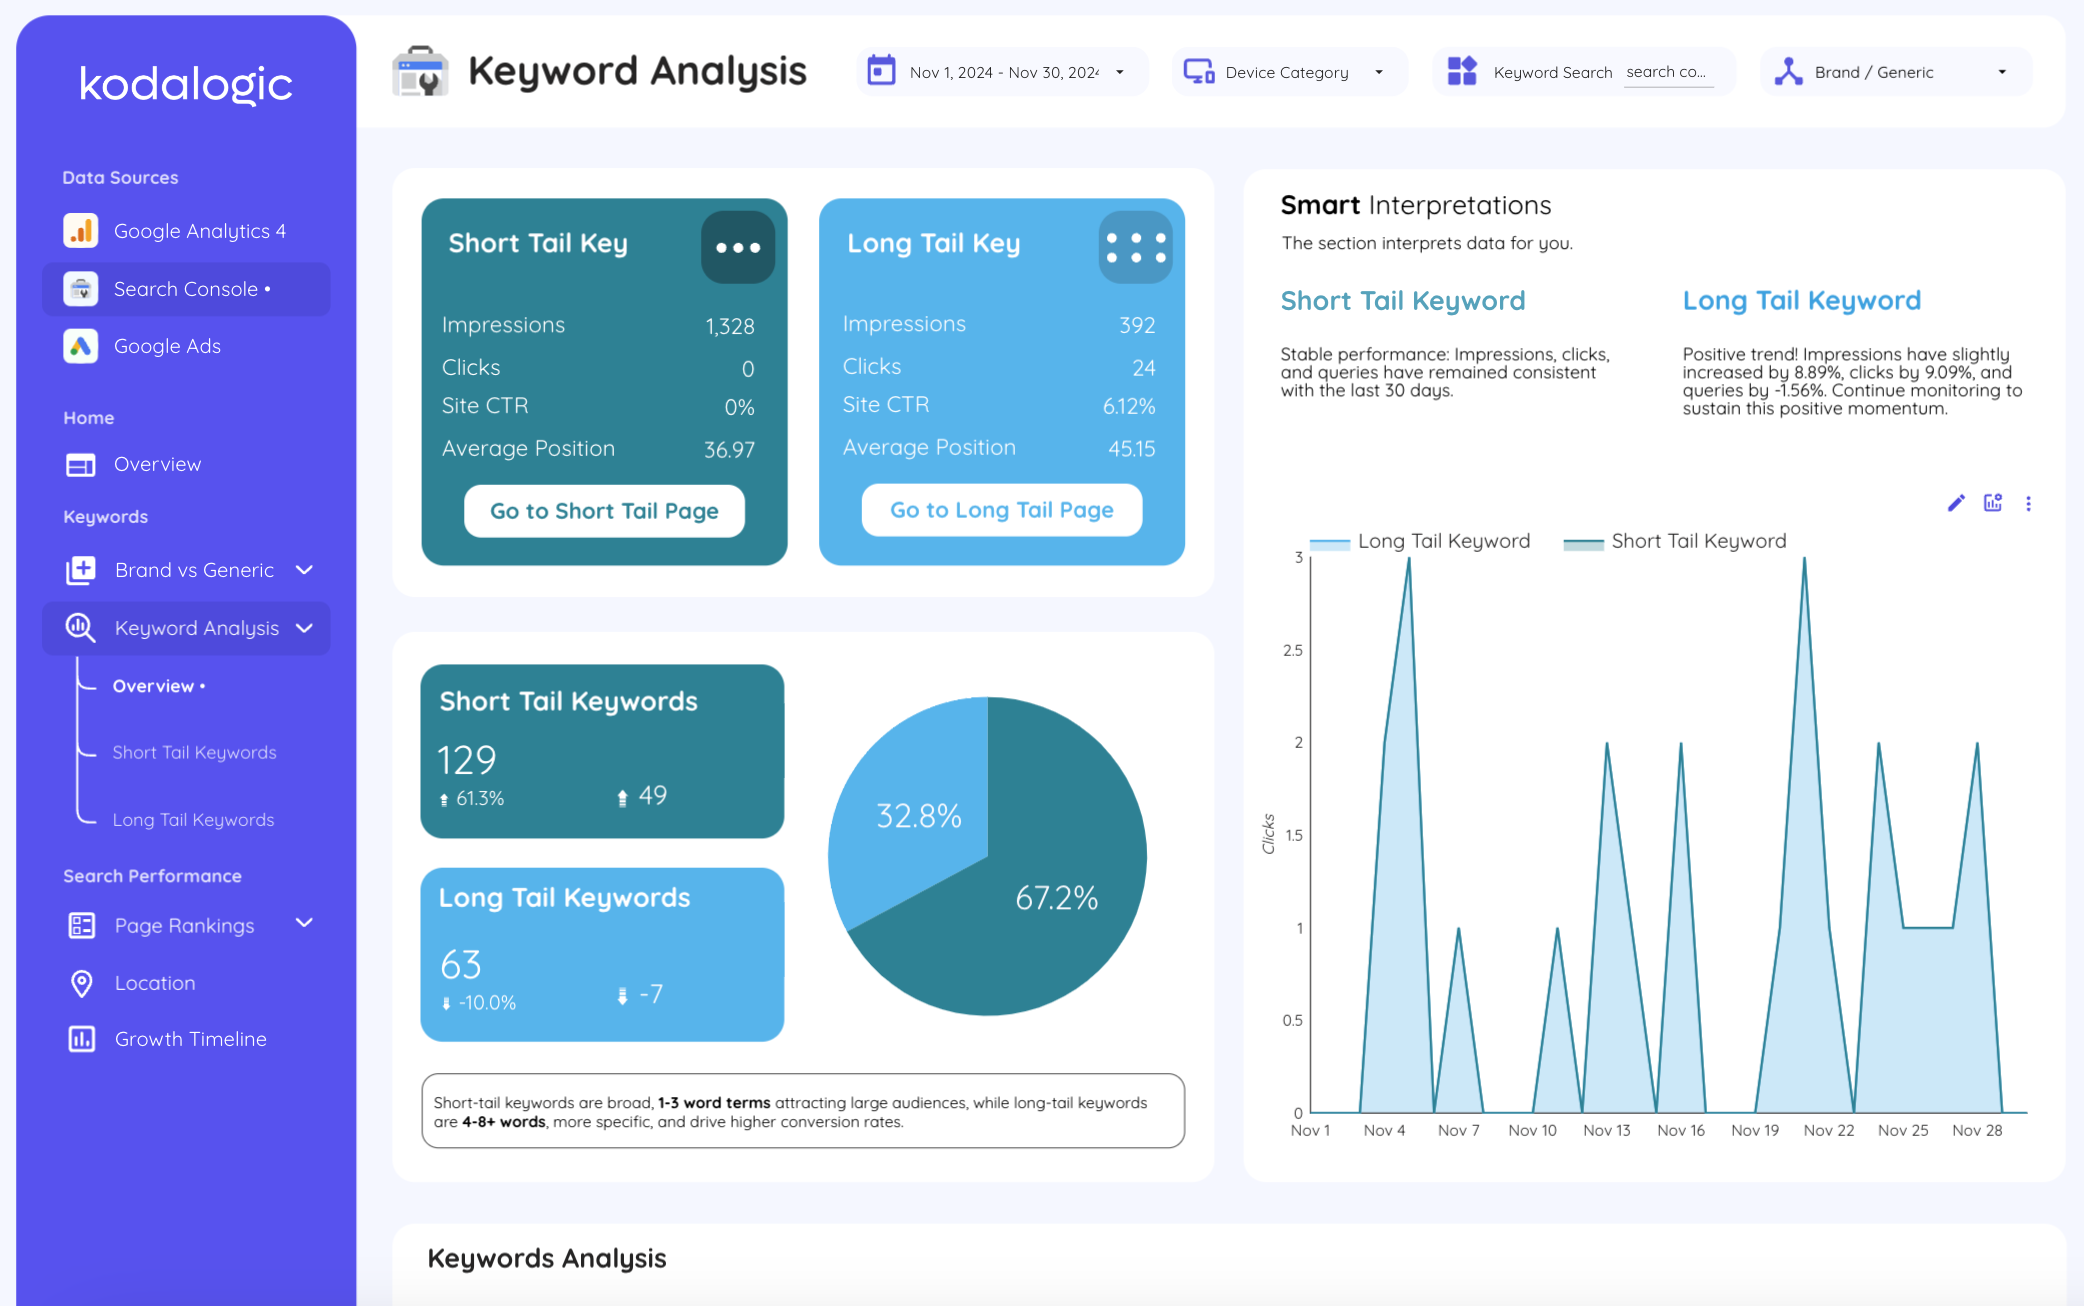
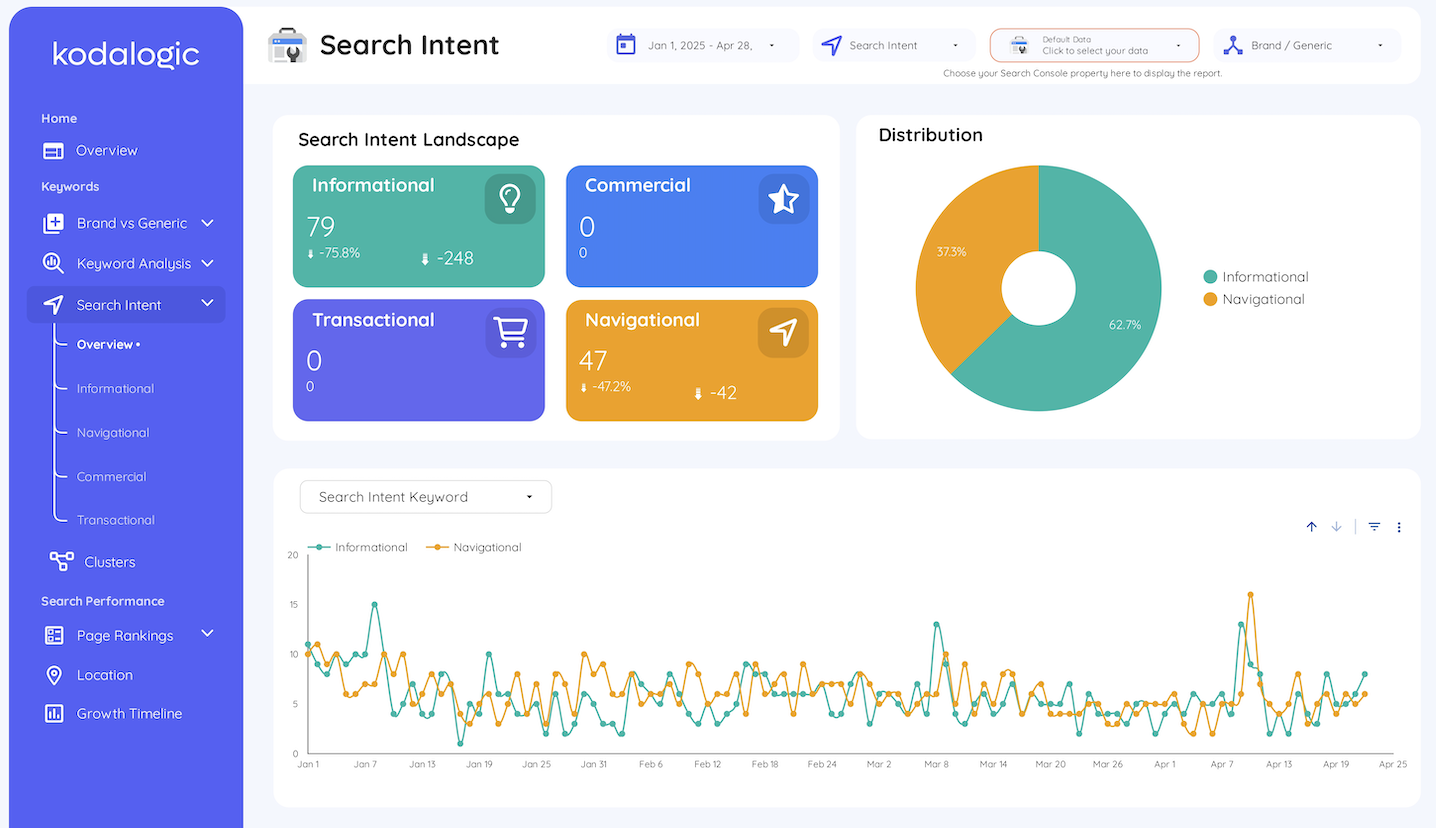
Keyword performance analysis dives into the detail that matters most. You see which search queries drive the most impressions. Which ones actually convert to clicks. Which keywords show declining rankings that need attention. This is where keyword strategy optimization happens. Which queries deserve more internal linking or content investment? Which ones indicate emerging opportunities?
Query level insights reveal user intent and competitive gaps. Sometimes high-impression queries get few clicks because you're not matching user intent correctly. Sometimes queries you've never optimized for suddenly start driving traffic, revealing topics your audience cares about. These insights shape content strategy.
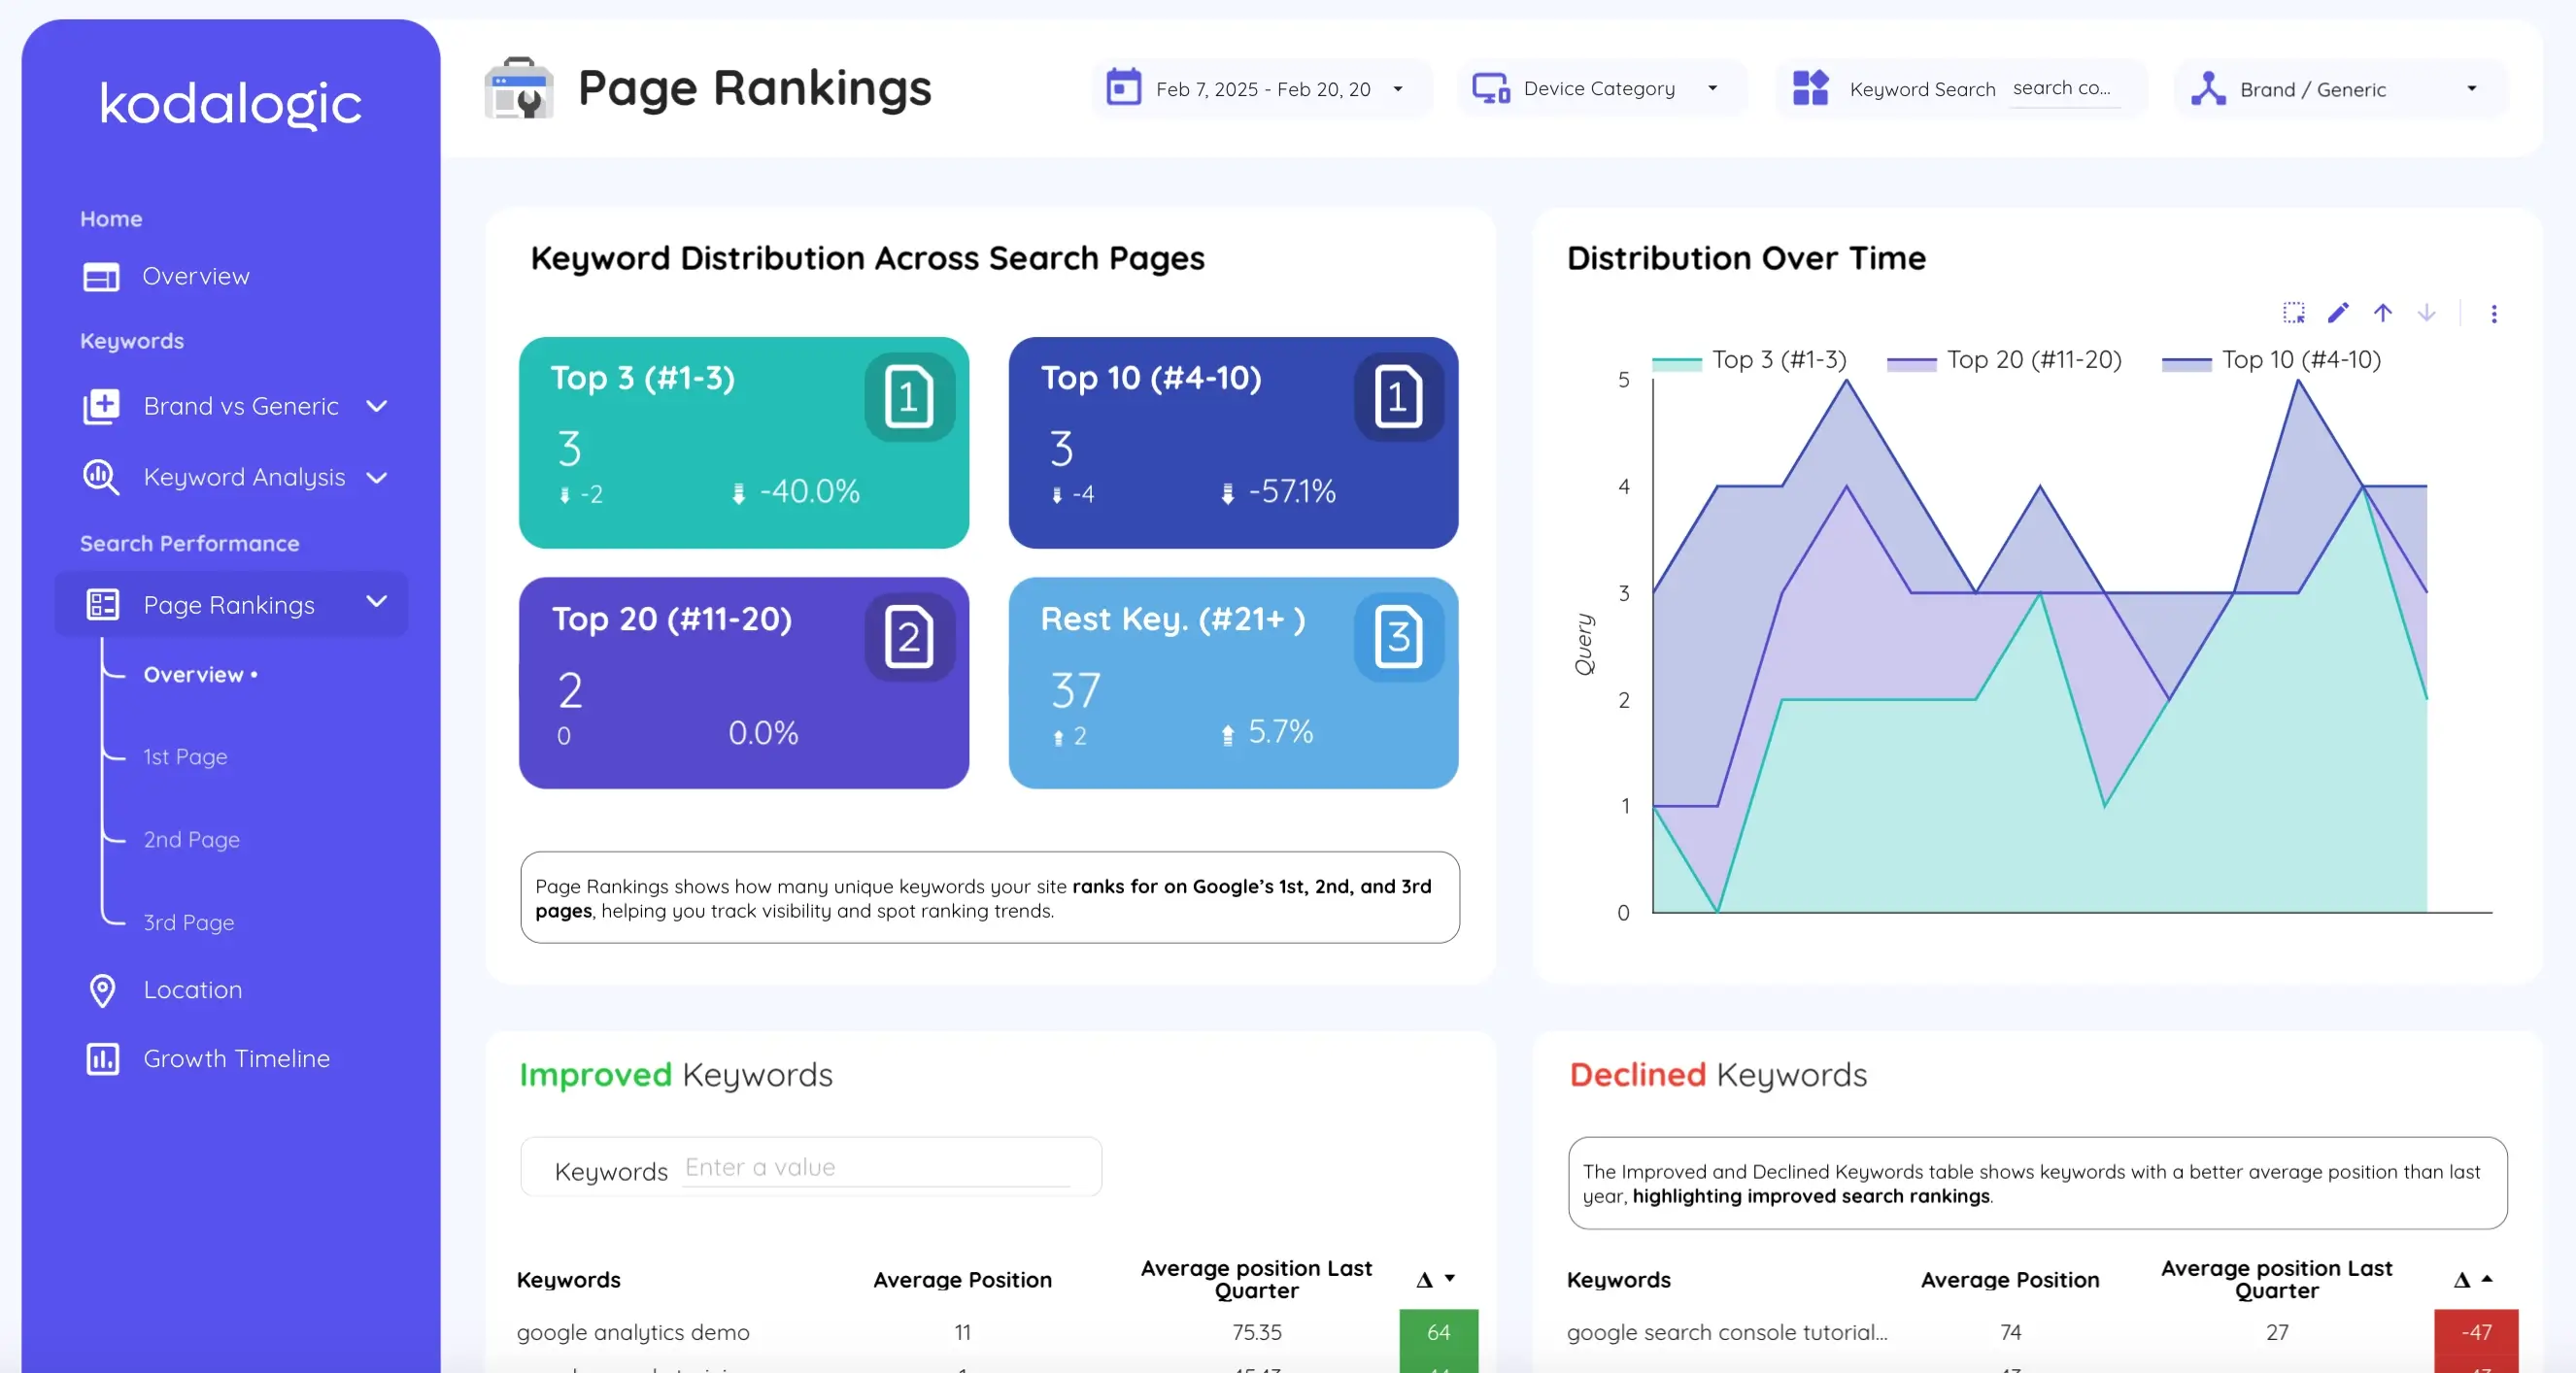
Page performance tracking shows which landing pages drive your rankings. Not all pages perform equally. Some individual pages rank for dozens of keywords. Others dominate search visibility. Understanding which pages are your ranking engines helps you identify which content types and topics resonate with search engines and users.
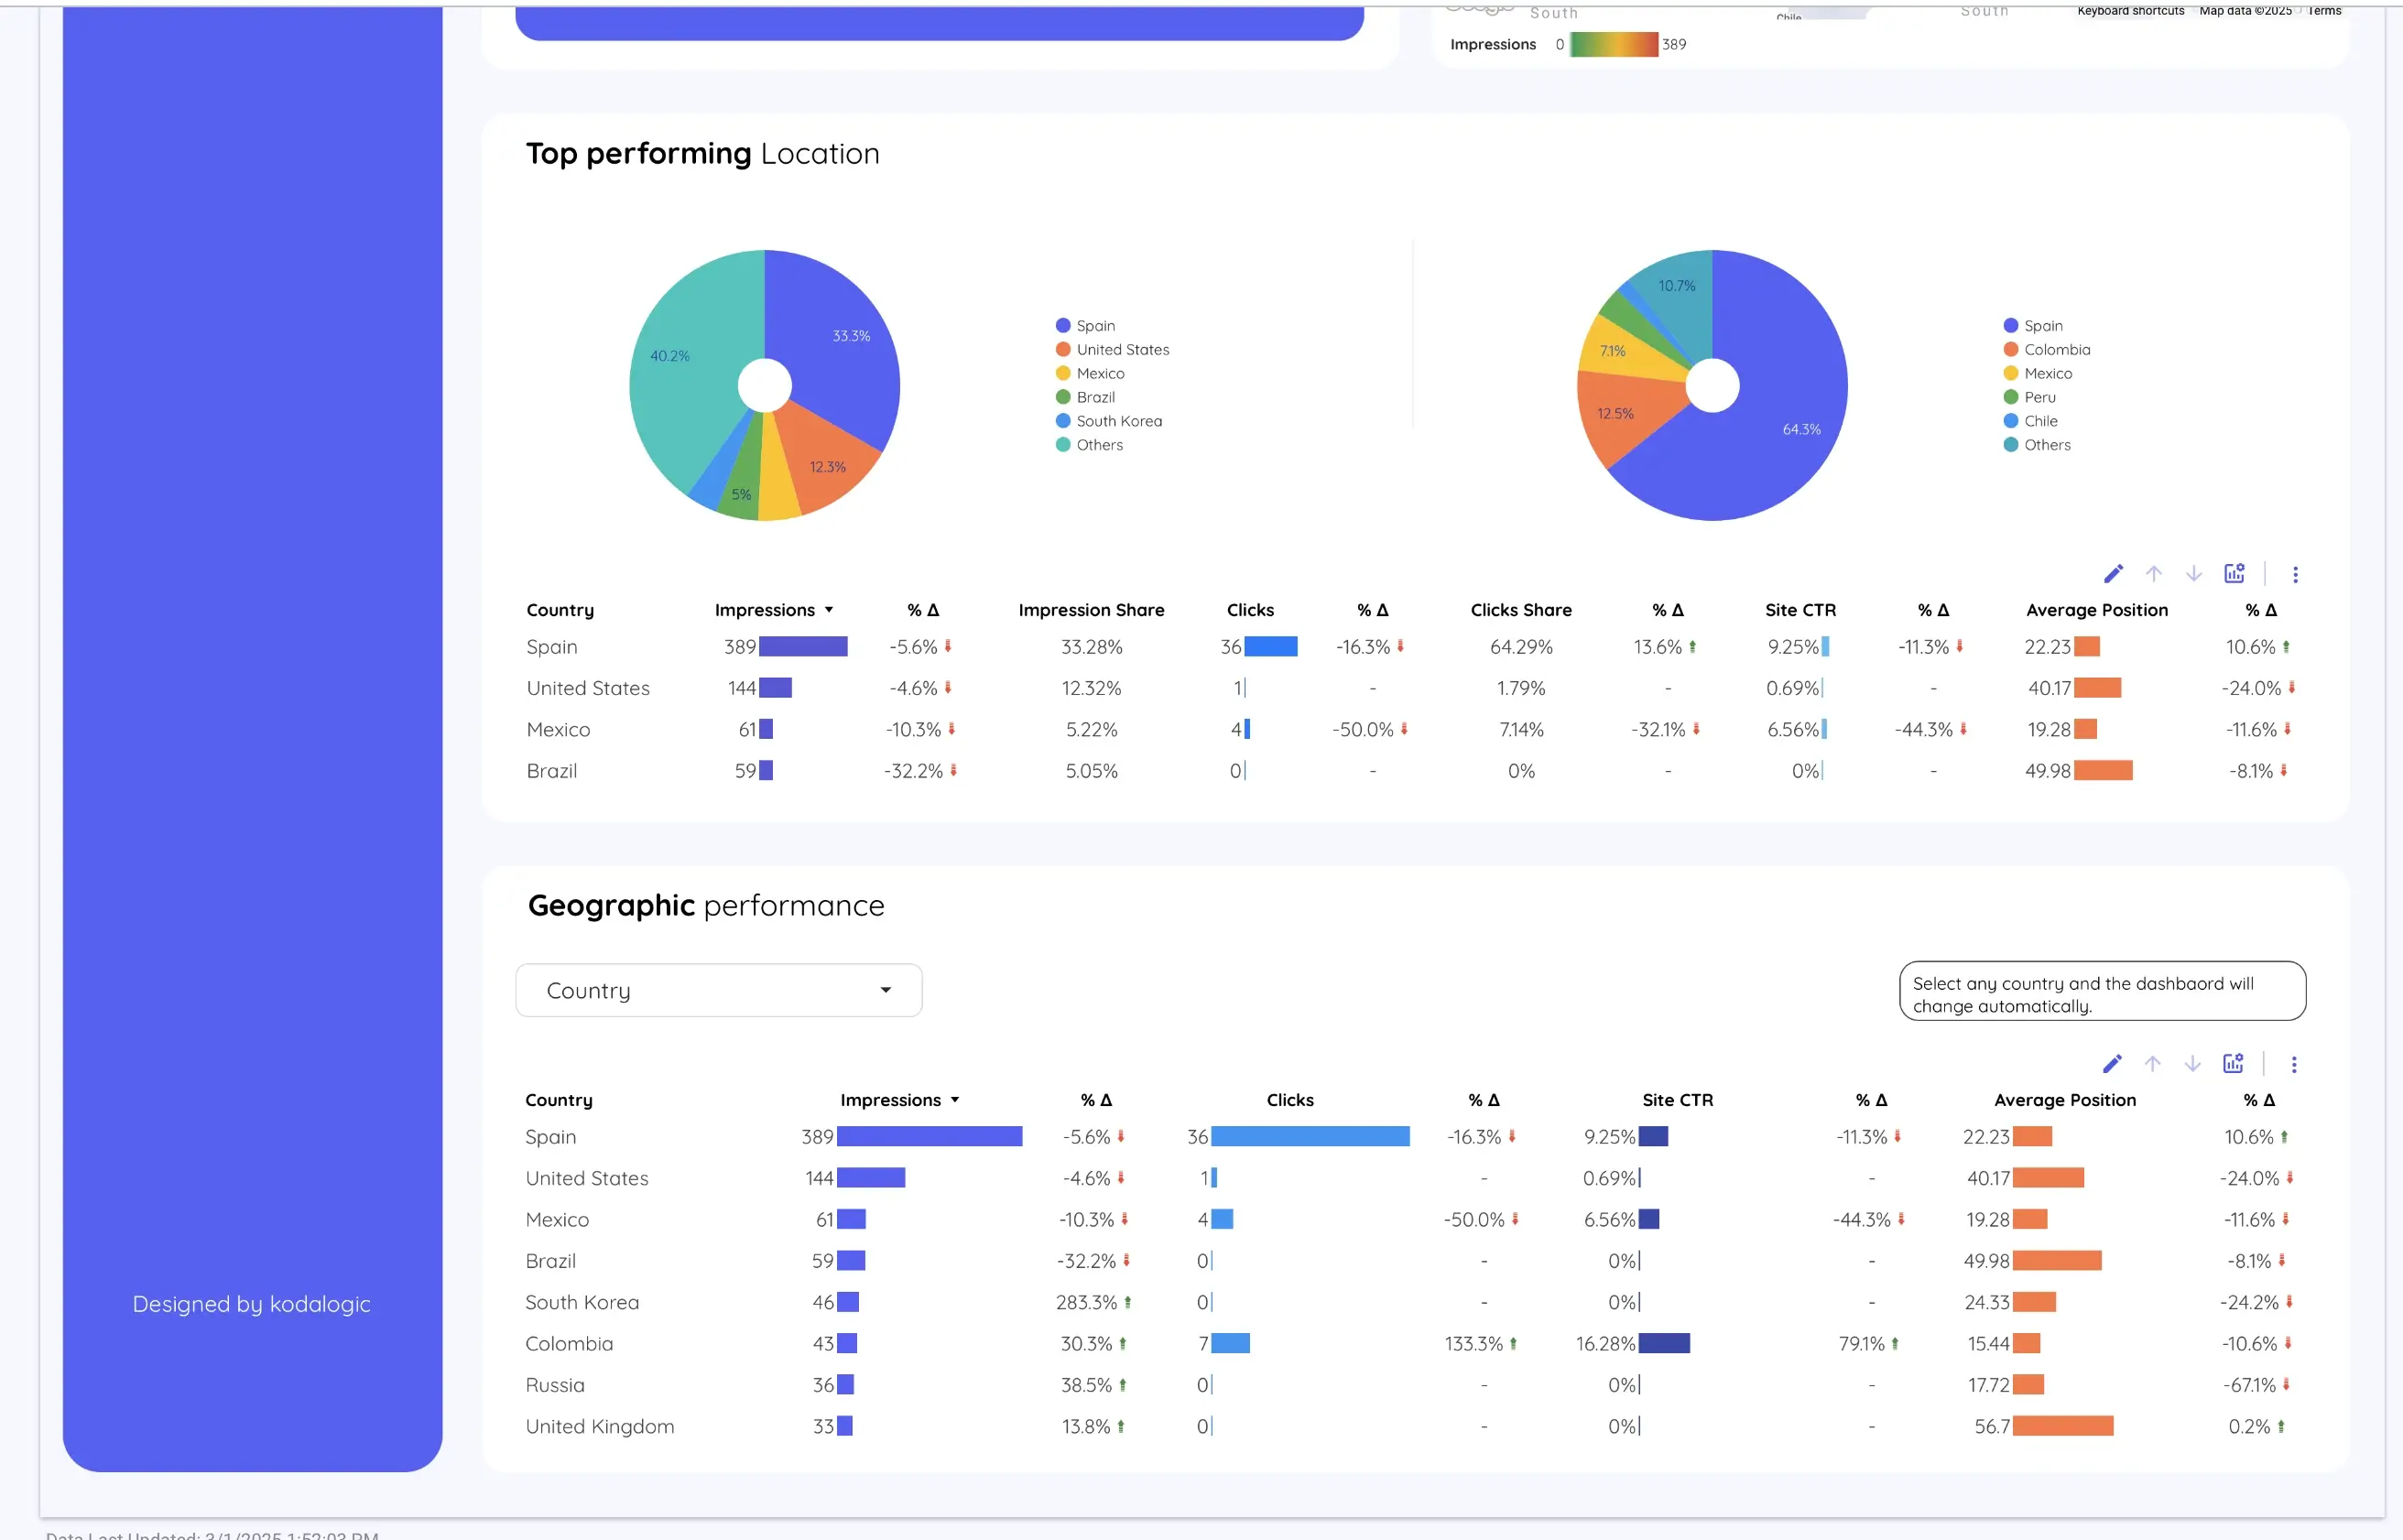
Geographic and device segmentation surfaces targeted opportunities. If your mobile traffic lags behind desktop, your mobile experience might need optimization. If certain geographic markets show strong ranking position but low clicks, that indicates title and description optimization opportunities in those markets.
Ranking distribution charts show your competitive landscape. How many of your keywords rank in positions one through three? How many sit in the ten to twenty range? How many haven't yet broken into the top one hundred? This distribution shapes your prioritization strategy.
Why Looker Studio Changed How SEO Professionals Report
Looker Studio connects directly to your Search Console property and pulls live data automatically. No more exporting. No more manual updates. Your dashboard reflects current search performance.
Before Looker Studio dashboards became common, teams faced these limitations. Building custom reports took days. Updating them took hours. Clients received static PDF reports that became outdated immediately. Sharing required complicated access management and multiple explanations about what the data meant.
Modern Looker Studio dashboards eliminate these friction points entirely. Connecting your Search Console property to Looker Studio helps you turn your SEO data into clear, visual reports. Instead of switching between the Search Console interface and spreadsheets, you centralize all your metrics into a single dashboard.
The advantages compound quickly. Real time data means your reports stay current without ongoing effort. Interactive dashboards let stakeholders explore different time periods and filters without asking for new versions. Automated scheduling delivers reports without human intervention. Mobile responsive design means insights work on any device.
If your team spends ten hours monthly compiling Search Console reports manually, Looker Studio saves those ten hours every single month. That's one hundred twenty hours annually. Multiply by team size and the cumulative time savings become staggering. More importantly, your team can redirect that time toward strategy and optimization instead of report building.
Campaign Performance Metrics That Actually Matter
Not all Search Console metrics deserve equal attention. Some look impressive but don't predict business outcomes. Others quietly reveal whether your SEO strategy works.
Impressions show visibility but not value. High impressions with low clicks means users see your result but don't think it's relevant. This signals opportunity: improve your title tags and meta descriptions to increase click through rate from your current ranking position.
Clicks indicate user interest but not engagement. Someone saw your search result and clicked to visit your site. That's meaningful, but only if they find what they're looking for once they arrive. Clicks without subsequent engagement suggest content relevance or user experience issues.
Click through rate reveals search snippet effectiveness. Your CTR compared to your ranking position shows whether your title and description are compelling users to click. If you rank position three but have a two percent CTR while competitors at the same position have five percent CTR, your search snippet needs optimization.
Average position predicts click opportunity. Keywords ranking seventh when fourth is achievable represent significant lost potential. If you're not yet ranking top three for your most important keywords, improving position directly improves visibility and clicks.
Query to page matching reveals content structure opportunities. Sometimes users search for something specific but land on a general page. This shows where creating targeted content or better internal linking could improve performance.
Tracking these metrics together reveals optimization priorities. Which keywords deserve more content investment? Which landing pages need title tag improvements? Which topics represent genuine opportunities versus vanity rankings?
How Unified Search Console Dashboards Transform Strategy
The difference between working directly in Search Console and using a unified dashboard compounds over time in ways that spreadsheets can never match.
Strategy teams spend less time gathering data and more time analyzing it. Instead of Friday morning exporting Search Console data, Friday morning is spent discussing which keywords to prioritize next month. Instead of asking questions and waiting for analysis, answers appear instantly in your dashboard.
Clients gain confidence in your work when they see clear visualizations of their search rankings and click trends. Instead of explaining rankings matter, your dashboard shows their ranking improvements, the resulting click increases, and traffic growth directly. This builds trust and justifies fee increases.
By consolidating metrics into a single dashboard, you can quickly visualize rankings, check top performing queries, and track keyword movements over time. This simplification removes analysis paralysis and focuses energy on actual optimization.
Team collaboration improves because everyone references the same dashboard. Your content team sees which topics drive search visibility. Your technical SEO team sees whether crawl or indexation issues affect rankings. You're all looking at the same truth rather than arguing about which export is most recent.
Setting Up Your First Search Console Dashboard
The setup process differs from working directly in Search Console, which requires understanding how to navigate multiple reports and manually export data.
With pre-built templates, the setup is straightforward. You open a template link. You authorize your Search Console property. The dashboard automatically pulls your data and structures it meaningfully.
The template handles the technical complexity of understanding which Search Console dimensions pair naturally and which metrics matter most. Your data populates instantly. Within minutes you're looking at a professional dashboard that would have taken your team days to build from scratch.
From that point, customization is optional. The template works immediately. You can adjust date ranges, filter by specific keywords or pages, or add custom segments if particular metrics matter for your use case. But all of that is optional. The dashboard delivers value from day one.
Compare this to building a custom dashboard from scratch. You'd need to understand Search Console data structures, learn Looker Studio's visualization options, design your own charts, and test everything. The learning curve alone takes weeks. Most teams never finish because the complexity exceeds their bandwidth.
Keywords to Track in Search Console
Focusing on keyword performance separates good SEO from excellent SEO. Your dashboard should highlight keywords that deserve attention across several categories.
Top ten keywords represent your ranking strength. These keywords show where you're winning in search. Understanding why these queries rank well informs your strategy for other terms.
High volume keywords with declining positions need investigation. Your ranking might be slipping. Competitors might be ranking higher. The search results landscape might be shifting. These require attention before you lose significant visibility.
Keywords with high impressions but low CTR represent immediate optimization opportunities. Improve your title tag and meta description. These queries show search intent matches your content, but users aren't clicking your result.
Emerging keywords showing growth signal emerging opportunities. These terms might not drive significant volume yet. But if they're increasing in impressions and clicks, they represent topics your audience is increasingly searching for.
Long tail keywords with high CTR often convert better than generic terms. These might not drive massive traffic volume. But they're the best use of your optimization effort because they indicate clear search intent that aligns with your offering.
Real World Search Console Performance Patterns
Understanding typical search performance helps set realistic expectations and identify genuine opportunities.
Query data quality varies based on search type. Most organic search traffic comes from web search. Some websites see significant image search traffic. Others serve niches where news search or video search matters. Understanding your particular distribution shapes keyword strategy.
Ranking position distribution matters immensely. Websites dominating their niche might have hundreds of keywords in the top three. Newer websites might have most keywords in the fifty to one hundred range. Your distribution reveals your competitive position and growth trajectory.
Device performance differences reveal optimization gaps. Mobile-first indexing means Google primarily crawls and ranks your mobile version. If mobile rankings lag behind desktop, your mobile site needs optimization work.
Future Proofing Your Search Console Reporting
Digital search evolves continuously. Google updates ranking algorithms. Search results layouts change. User behavior shifts toward voice search and AI-powered answers.
Building reporting around solid SEO metrics future proofs your approach. Rankings matter today and will matter tomorrow. Search impressions will continue to matter. Click through rate will always reveal snippet effectiveness. These fundamentals don't change even as search evolves.
Dashboards built on these core metrics remain valuable even as search changes. You're measuring what matters, not what's trendy or temporary.
Stay current with Google's updates. Google continuously updates Search Console's interface and reporting capabilities. Using dashboard templates maintained by professionals ensures your reporting reflects current best practices. You're not trying to retrofit old dashboards into new systems.
Search Console Performance After Automating Your Dashboard
The difference between manual Search Console reporting and automated dashboards compounds over time in ways that spreadsheets can never match.
Instead of Monday mornings spent in Search Console gathering data, Monday mornings become strategic planning. You're identifying optimization opportunities rather than formatting data. Tuesday isn't spent calculating click through rates. Tuesday is spent planning content around keywords you've identified as opportunities. By Friday, you've prioritized your content calendar based on real search data rather than guesses.
Your team finds more satisfaction in their work. They're solving SEO problems rather than repeating data entry tasks. They're thinking strategically rather than administratively. Retention improves because people prefer roles with measurable impact and intellectual challenge.
Clients see performance more frequently. Instead of quarterly reports, your dashboard provides real time visibility. Clients gain confidence in your management. They understand what's working and why. They feel informed about how you're deploying your optimization effort.
This cycle creates a feedback loop where visibility drives better decisions, better decisions drive better rankings, and better rankings build lasting client relationships.
Getting Started Today
The gap between wanting streamlined Search Console reporting and having it has never been smaller.
You don't need a developer to build custom integrations. You don't need weeks learning complex tools. You don't need expensive consultants to configure your dashboard.
Purchase a pre-built Search Console dashboard template for Looker Studio that connects directly to your property. Click through the setup instructions. Connect your Search Console property. Your dashboard populates automatically with your actual ranking data.
Within minutes, you're looking at professional reporting that previously would have required significant time investment. Within the time it takes to drink a cup of coffee, your team has access to insights that used to take days to compile manually.
That efficiency is genuine. That strategic clarity is real. That competitive advantage is immediately actionable.
The only question is whether you'll implement this today or continue with the manual Search Console approach for the next reporting cycle.
Get the kodalogic Search Console dashboard template now. Transform your ranking data into strategy and stop spending hours on manual reporting.