06 of April of 2026
Automated SEO Reports: Stop Doing It Manually

Isaac Correa
Looker Studio Templates
SEO & Marketing Dashboards
Productivity & Automation
Every month, agencies waste 3 to 5 hours per client pulling the same data, building the same slides, and sending the same PDF nobody reads.
The Reporting Trap Most Agencies Are Stuck In
It starts small. One client, one monthly report. You export from Search Console. You pull the GA4 numbers. You paste everything into a spreadsheet, format it, drop it into slides, write two paragraphs explaining the trend, and send it.
One hour. Maybe two. Fine.
Then you have five clients. Then ten. And suddenly half your team's week is spent doing data entry instead of actual SEO work.
According to research covering agency workflows compiled by Fluency, 71% of agency teams say manual reporting processes are actively putting client campaigns at risk — not because the SEO work is poor, but because the time that should go into execution is being consumed by operational overhead. The same research puts the direct time cost at 3 to 5 hours per client per month for data gathering, formatting, and delivery.
For a ten-client agency at a loaded rate of $75 per hour, that's up to $5,000 a month in labor spent building documents that most clients skim for thirty seconds.
Something has to change.
What "Automated SEO Reporting" Actually Means
Before getting into the how, it's worth being precise about what we mean.
An automated SEO report isn't a fancier PDF. It's not a scheduled email with an attachment someone exported manually on Friday afternoon. A genuinely automated report connects directly to your data sources, updates itself, and delivers itself — with zero human intervention between one month and the next.
The data is live. The dashboard reflects what's happening right now, not what was happening when you last exported. Clients can open it at any time and see current numbers. You don't touch it after the initial setup.
That's the actual goal. Not "faster PDFs." No PDFs at all.
Why Manual Reporting Keeps Getting Worse
There's a structural problem with manual reporting that compounds as agencies grow.
When you have three clients, building individual reports is annoying but manageable. When you have fifteen, the process breaks down in ways that hurt both the agency and the client.
Errors multiply. Copy-pasting data across tools means transposed numbers, wrong date ranges, misapplied filters. One client who spots an inconsistency in their report doesn't just question that number — they question all of them. Trust erodes quietly, and by the time you notice, it's already a renewal conversation problem.
Customization suffers. When you're under time pressure to get ten reports out, every report starts looking the same. The enterprise ecommerce client gets the same structure as the local business. Neither report tells a story that actually matches what that client cares about.
Scaling becomes impossible. Research from Swydo puts time savings from automated reporting at up to 80% compared to manual workflows. At three hours per client per month, a ten-client agency is losing thirty hours monthly to mechanics. That's the equivalent of a full working week every single month — gone before a single optimization happens.
The Two Sources That Power Everything
A complete automated SEO report needs exactly two data sources. Not six. Not ten. Two.
Google Search Console tells you how your site performs in Google search. Impressions, clicks, CTR, average position, top queries, top pages. It's first-party data straight from Google, updated every two to three days. This is your organic visibility layer — what's happening before users arrive on the site.
Google Analytics 4 tells you what happens after they arrive. Sessions, engagement rate, conversions, revenue from organic traffic. It connects search performance to actual business outcomes.
The combination is what makes automated reporting genuinely useful rather than just convenient. As Google's own documentation confirms, Looker Studio connects natively to both at no cost, with data that updates automatically.
GSC shows how users found you. GA4 shows what they did next. Together, they answer the only question clients actually care about: is this SEO investment working?
How Looker Studio Automates the Whole Process
Here's what the automated workflow looks like once it's set up.
You connect your Search Console property and your GA4 property to Looker Studio. This takes about five minutes the first time. The connections are permanent — you don't repeat this step for future reports.
You build your dashboard structure once. Headline metrics at the top. Trend charts in the middle. Keyword performance table and top pages below. Date range controls so clients can explore different periods without asking you.
You schedule delivery. Looker Studio's built-in scheduling sends a PDF version of the report to any email address on a frequency you set — weekly, monthly, or custom. The data in that PDF reflects whatever is live at the moment of delivery. You set it once. It runs forever.
From that point forward, your monthly involvement drops to a single task: reviewing the numbers and writing a two-paragraph commentary. The agency that used to spend forty hours a month on reporting across fifteen clients now spends three.
That's not an exaggeration. Agencies that have automated their reporting workflows consistently report total manual time dropping to thirty minutes per month per client — a reduction of roughly 90% compared to fully manual processes.
What to Include in Every Automated SEO Report
Not everything that Looker Studio can show belongs in a client report. The mistake most agencies make when automating is building a dashboard that displays every available metric rather than the ones that answer real questions.
Keep it to five or six sections. Here's what works, based on building these dashboards across different industries and client sizes.
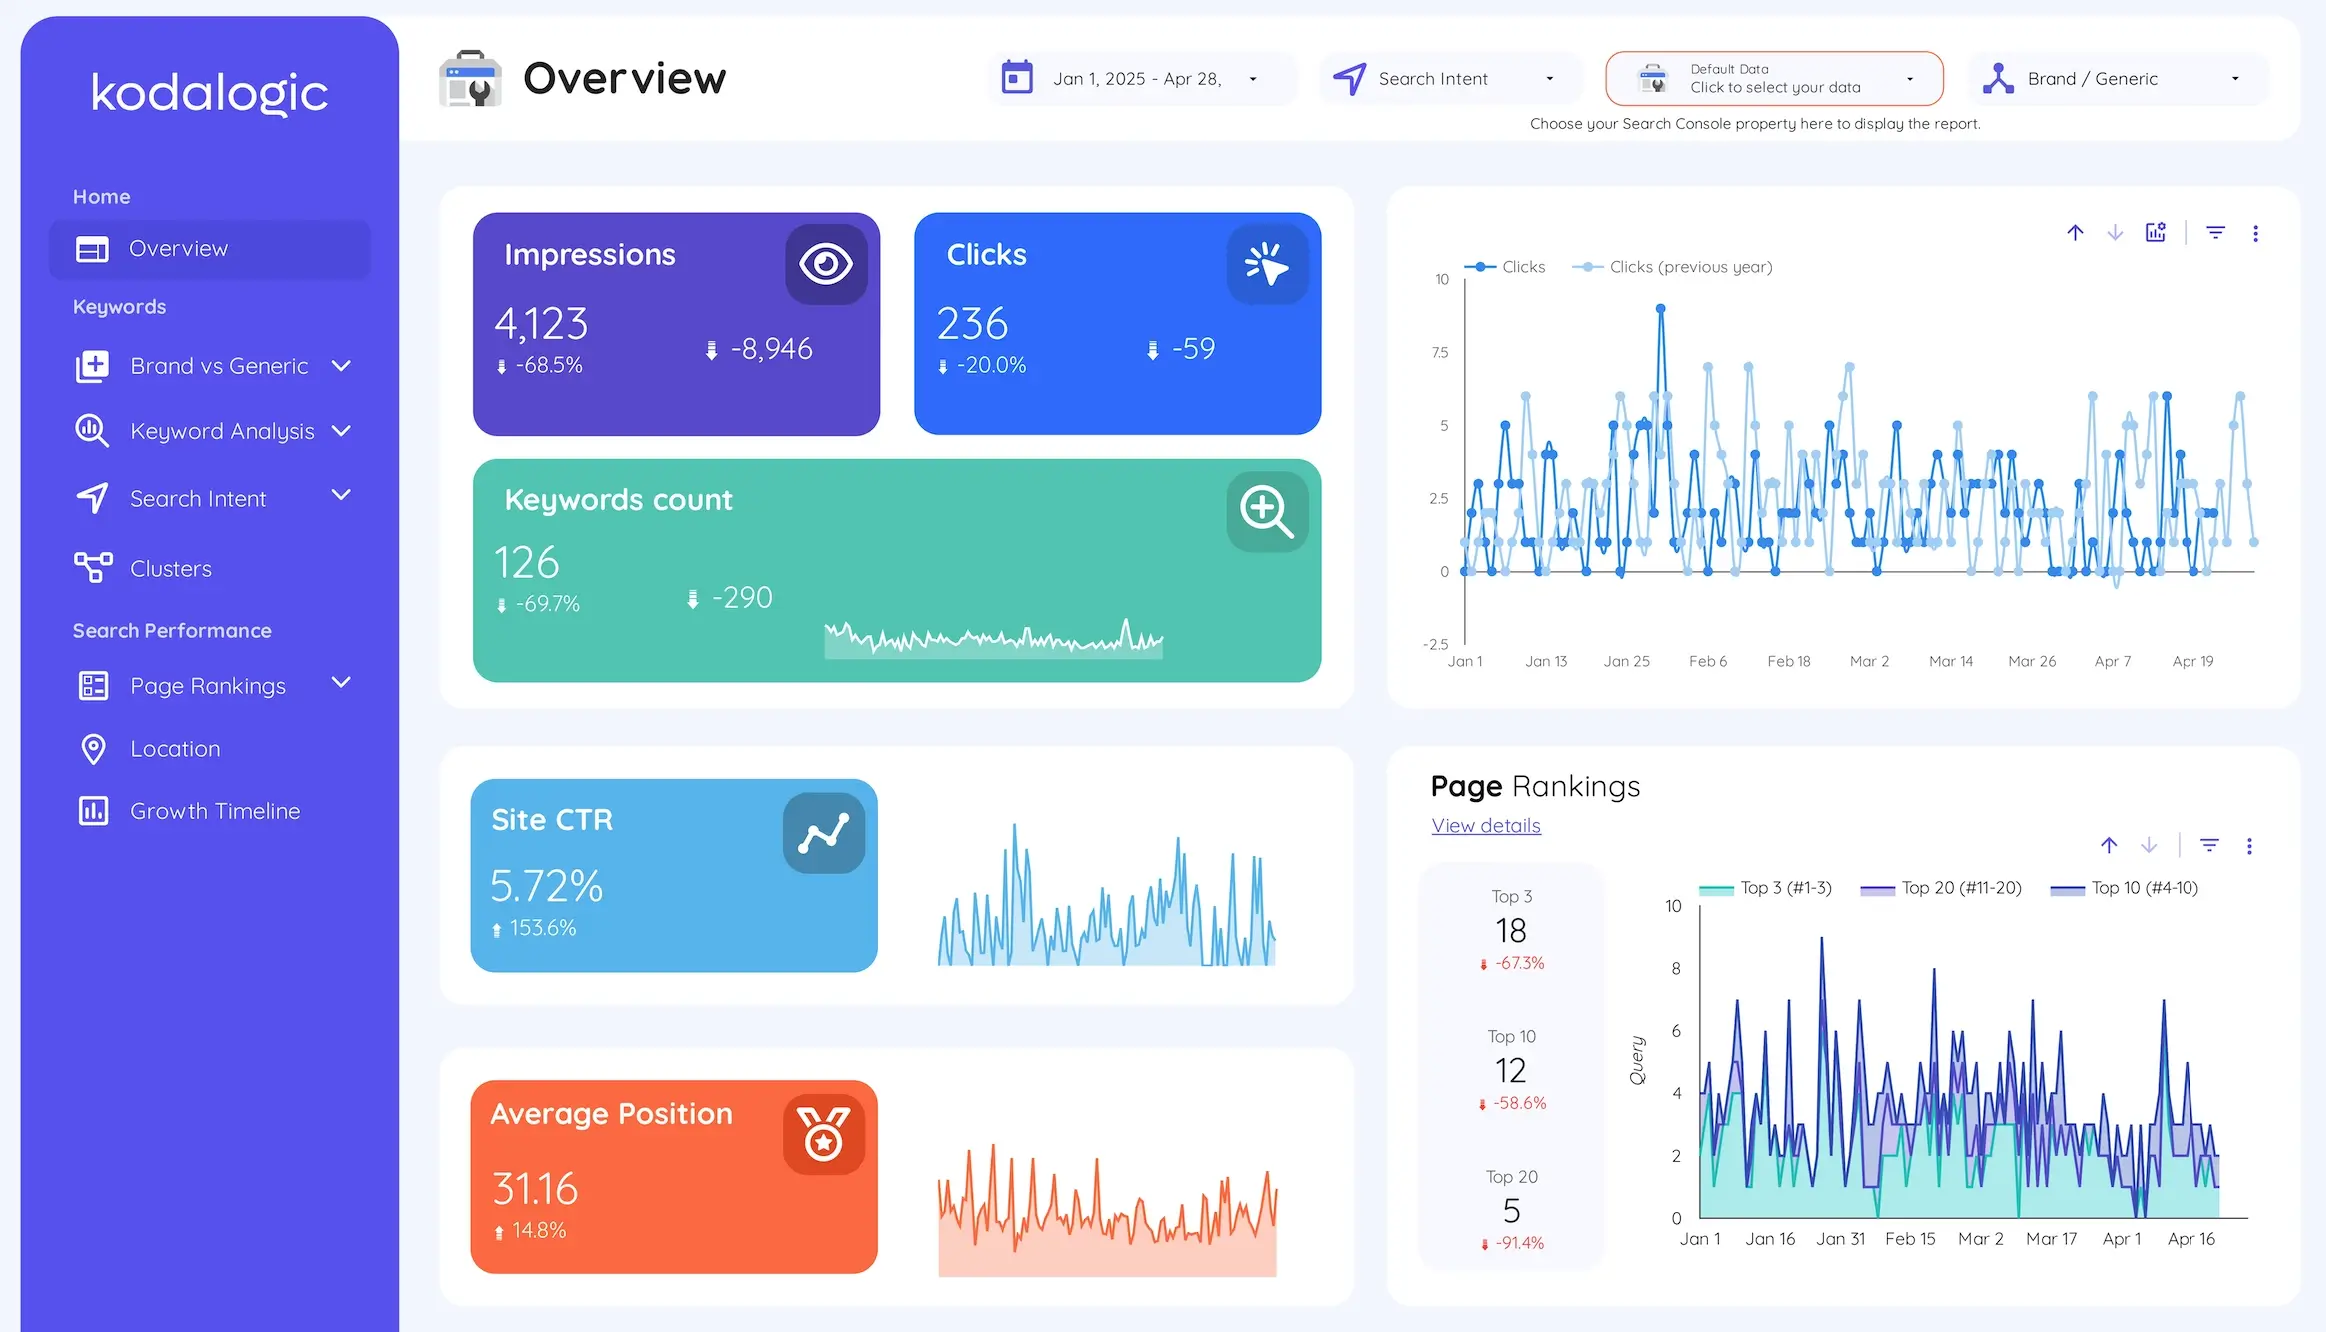
Traffic overview — total organic sessions versus the previous period, with a clear directional indicator. This answers the first question every client asks: "Is traffic going up or down?"
Search visibility — total impressions and clicks from Search Console, trended over time. Impressions growing before clicks is a good sign. Both flat or falling means something needs attention.
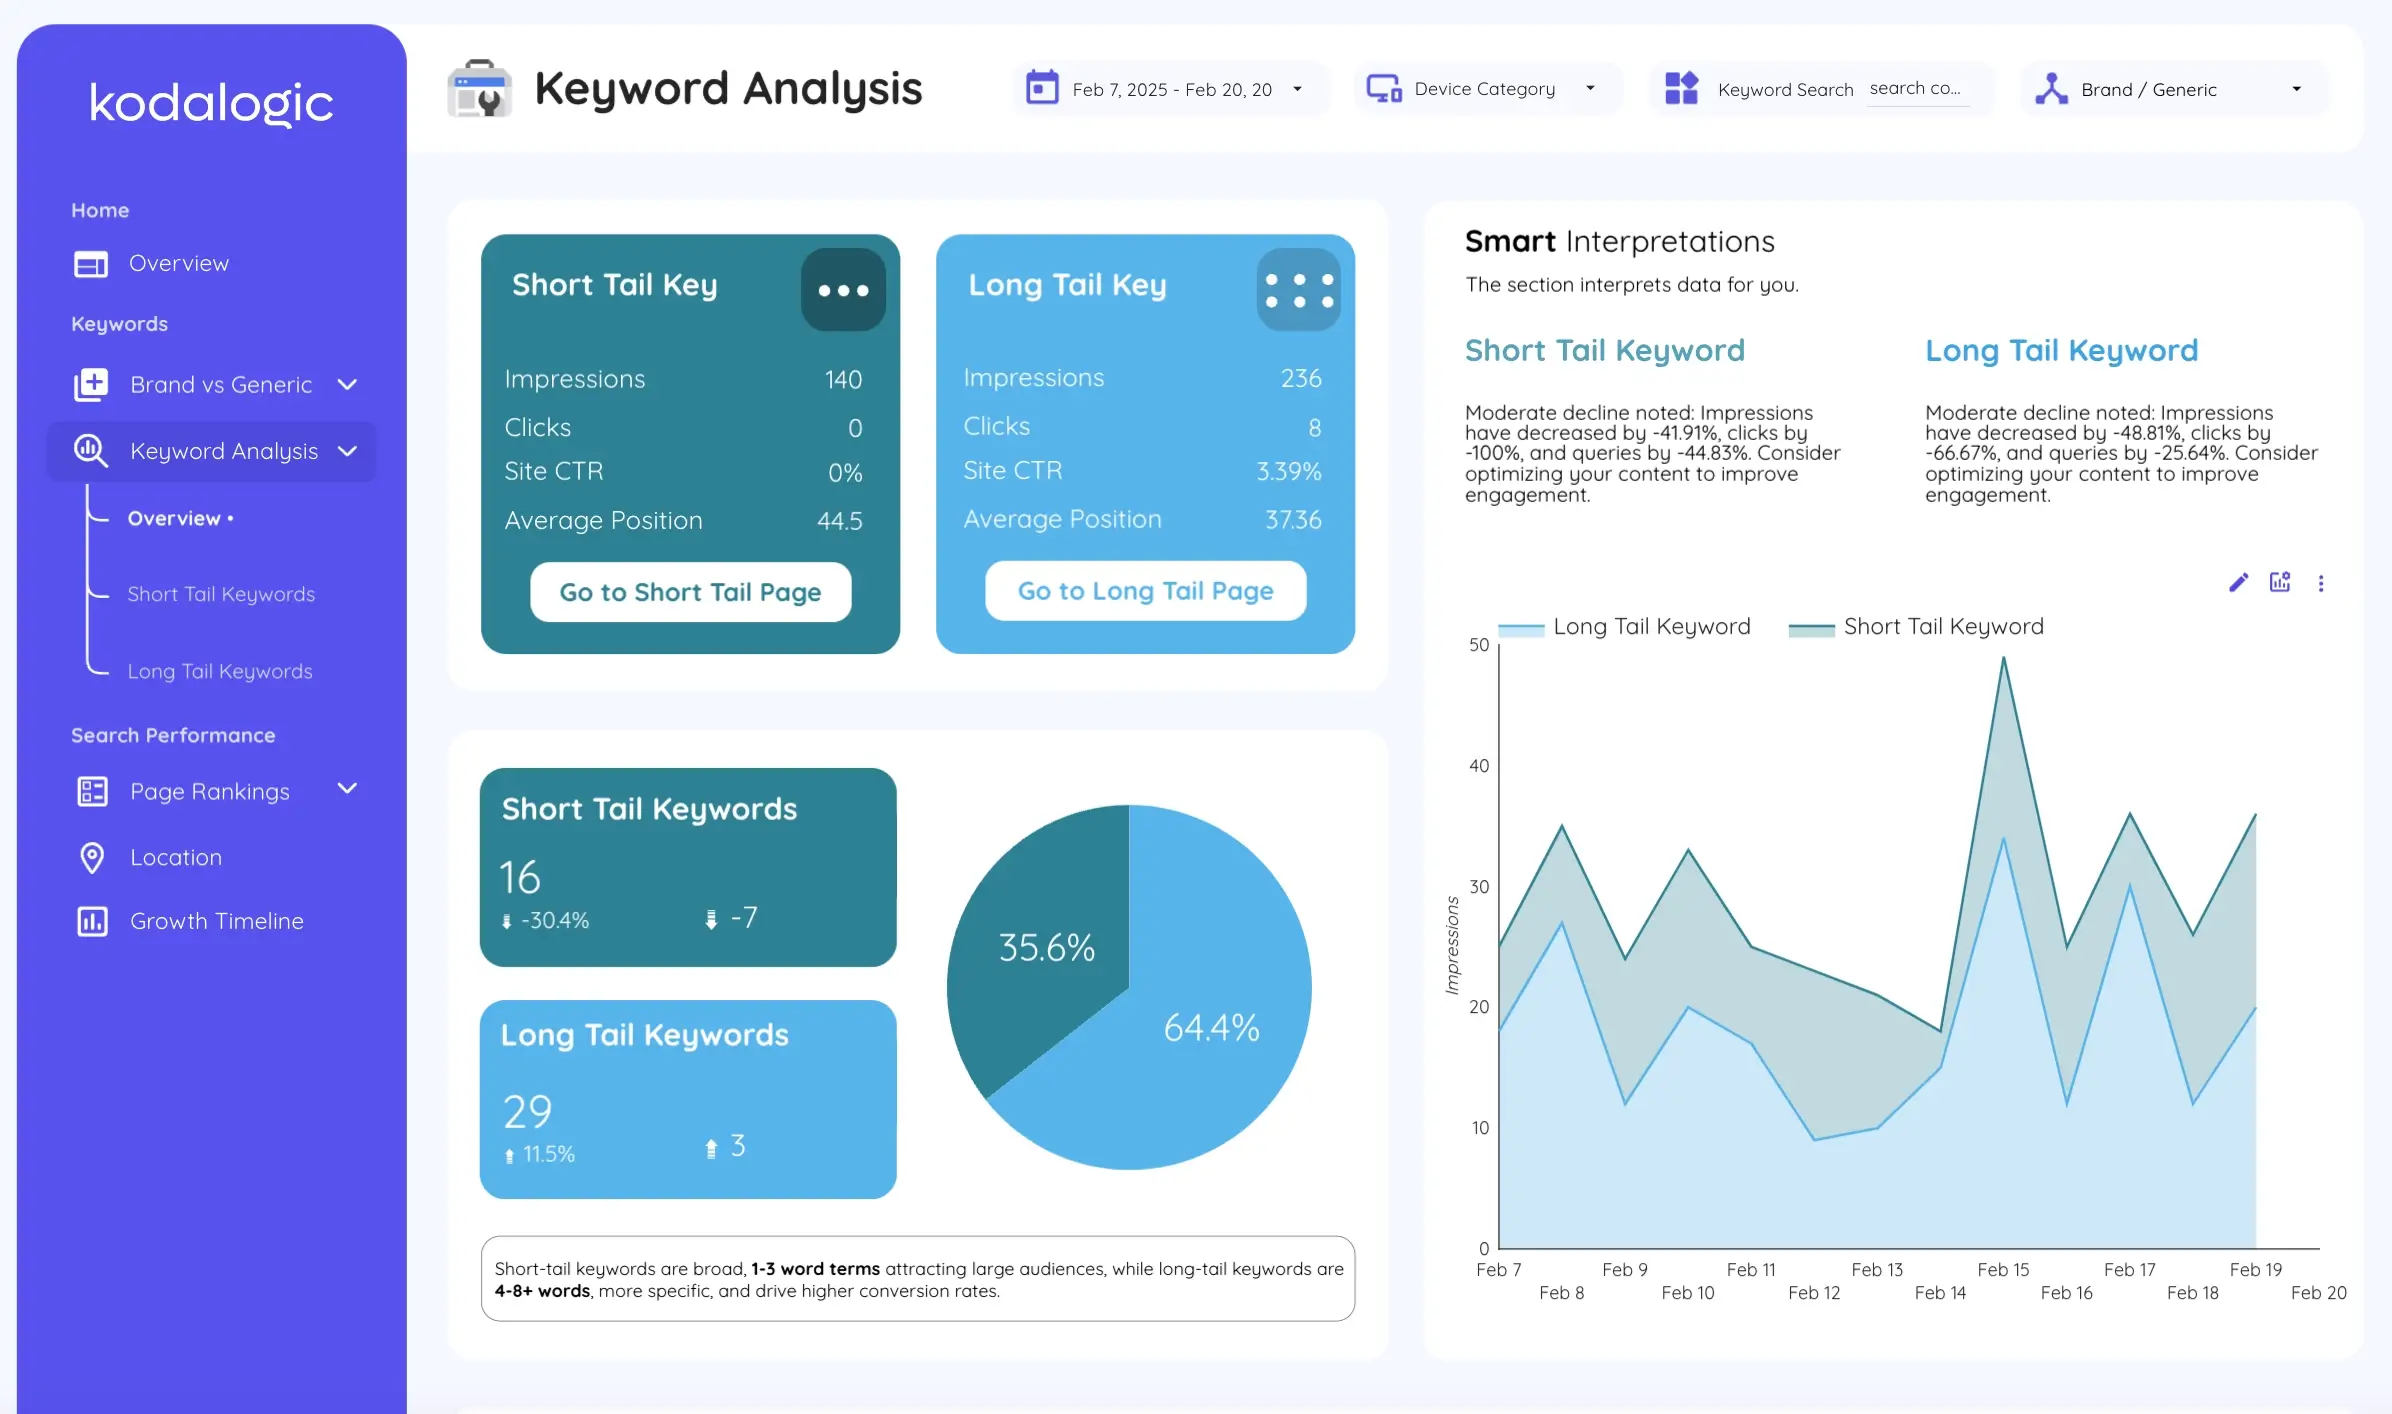
Top queries — the twenty keywords sending the most clicks, with their average position and CTR. This is where strategic conversations happen. Which keywords are close to page one? Which have strong impressions but low CTR?
Top pages — which landing pages are driving organic traffic. Not all pages perform equally, and knowing which ones are carrying the load shapes content and link-building priorities.
Channel split — organic versus paid versus direct versus referral. Clients need context. A month where organic sessions fell but total sessions held steady is a very different situation from one where everything fell.
Conversions from organic — goals completed, leads generated, or revenue attributed to organic sessions. This is what connects SEO performance to business outcomes, and it's the section that most directly justifies the retainer.
If you're not sure how to structure these sections inside Looker Studio, our post on 15 tips for building smarter dashboards walks through the setup in detail.
Setting Up Scheduled Delivery: The Exact Steps
Once your dashboard is built, scheduling delivery takes under ten minutes. Here's exactly how it works in Looker Studio.
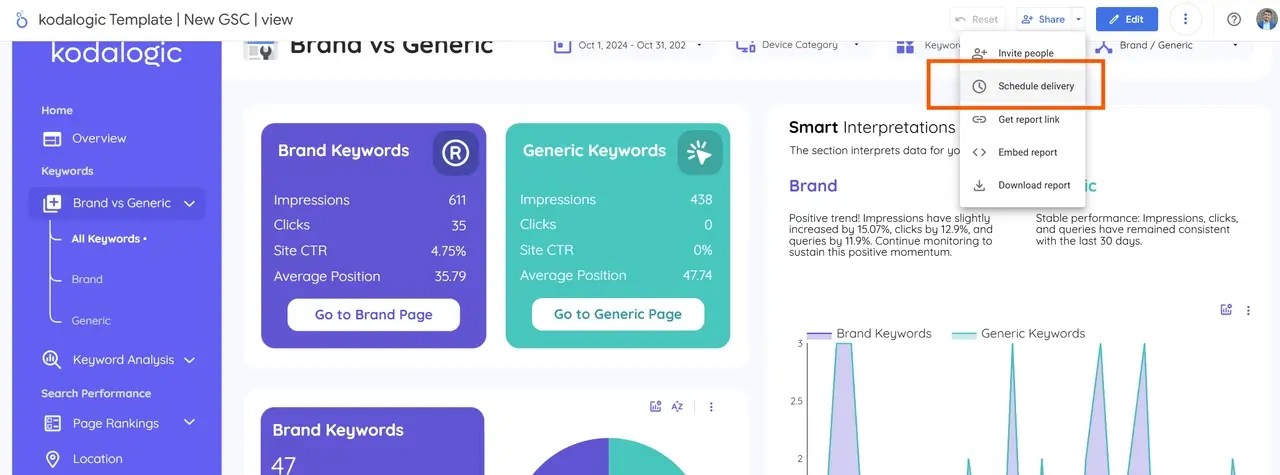
Open your report and click Share in the top right corner. Select Schedule delivery from the dropdown. A panel opens on the right side of the screen.
Add your recipients. You can include any email address — it doesn't need to be a Google account. Add your client, your account manager, whoever needs to see the report.
Choose your frequency. Monthly is the standard for most SEO clients. Weekly works for accounts where performance changes quickly or clients who want more visibility. The custom option lets you set specific days and times — useful if you want reports to land Monday morning before weekly calls.
Set your start date and time. Then click Save.
That's it. The report will send automatically at every scheduled interval, with live data, formatted as a PDF, with a link back to the interactive version. You don't need to do anything else until you want to change something.
We cover additional best practices for scheduled reporting — including how to handle multiple clients and permission settings — in our dedicated guide on how to schedule a dashboard in Looker Studio for email delivery.
The Difference Between Automated and Actually Good
Automation handles the mechanics. It does not handle the thinking.
The agencies that retain clients longest aren't the ones with the most automated workflows. They're the ones who use automation to free up time for the part that actually builds relationships: the interpretation layer.
A good automated report delivers the data. A great monthly check-in pairs that data with two or three sentences of genuine analysis. What moved this month and why. What the team is focusing on next. Whether the number that went up is something to celebrate or something to be cautious about.
That thirty-minute review before the report goes out — reading the numbers, writing a short commentary, flagging anything unusual — is where the value is. Automation doesn't replace that. It protects the time you need for it.
The goal isn't zero human involvement. It's zero wasted human involvement.
Starting Without Building From Scratch
Building a clean, well-structured SEO report in Looker Studio from a blank canvas takes time. Getting the data connections right, deciding on the layout, making sure the date comparisons work the way you expect — most agencies spend several hours on the first client setup, then replicate it across their book of business.
That's the practical case for starting with a template rather than from zero.
The Kodalogic SEO dashboard templates connect directly to Search Console and GA4, populate your data automatically, and are structured around the six-section framework described above. You spend five minutes connecting your data instead of an afternoon building structure from scratch.
Your first automated report can go out this week, not next month.