12 of April of 2026
What Is Smart Interpretations? The Looker Studio Feature That Writes Your SEO Analysis

Isaac Correa
Looker Studio Templates
SEO & Marketing Dashboards
AI & Emerging Technologies
Every SEO dashboard on the market shows you data. Smart Interpretations is the only one that reads it and writes the analysis for you — automatically, in plain language, without any manual work. Here is exactly how it works.
There are two types of Looker Studio dashboards. Ones that show you the data. And one that tells you what it means. Smart Interpretations is the second type. Nothing else on the market is.
The Gap Every SEO Dashboard Leaves Open
Open any SEO dashboard — any Looker Studio template, any competitor product, any report in Google's official gallery. You will see the same thing: charts, tables, rankings, trends, CTR over time.
What you will not see is an explanation of what any of it means.
That gap — between data on screen and analysis in plain language — is where SEO reporting time goes. You look at a ranking drop and spend fifteen minutes figuring out whether it is significant or noise. You see CTR fall on a page and work out what to do about it. You check the brand versus generic split and decide what it signals.
This interpretation work is manual. It is repetitive. And for teams managing multiple clients or properties, it compounds into a real cost — time that should go into optimization going into explanation instead.
Smart Interpretations closes that gap at the source. The analysis is written automatically, inside the dashboard, every time it loads.
What Smart Interpretations Actually Does
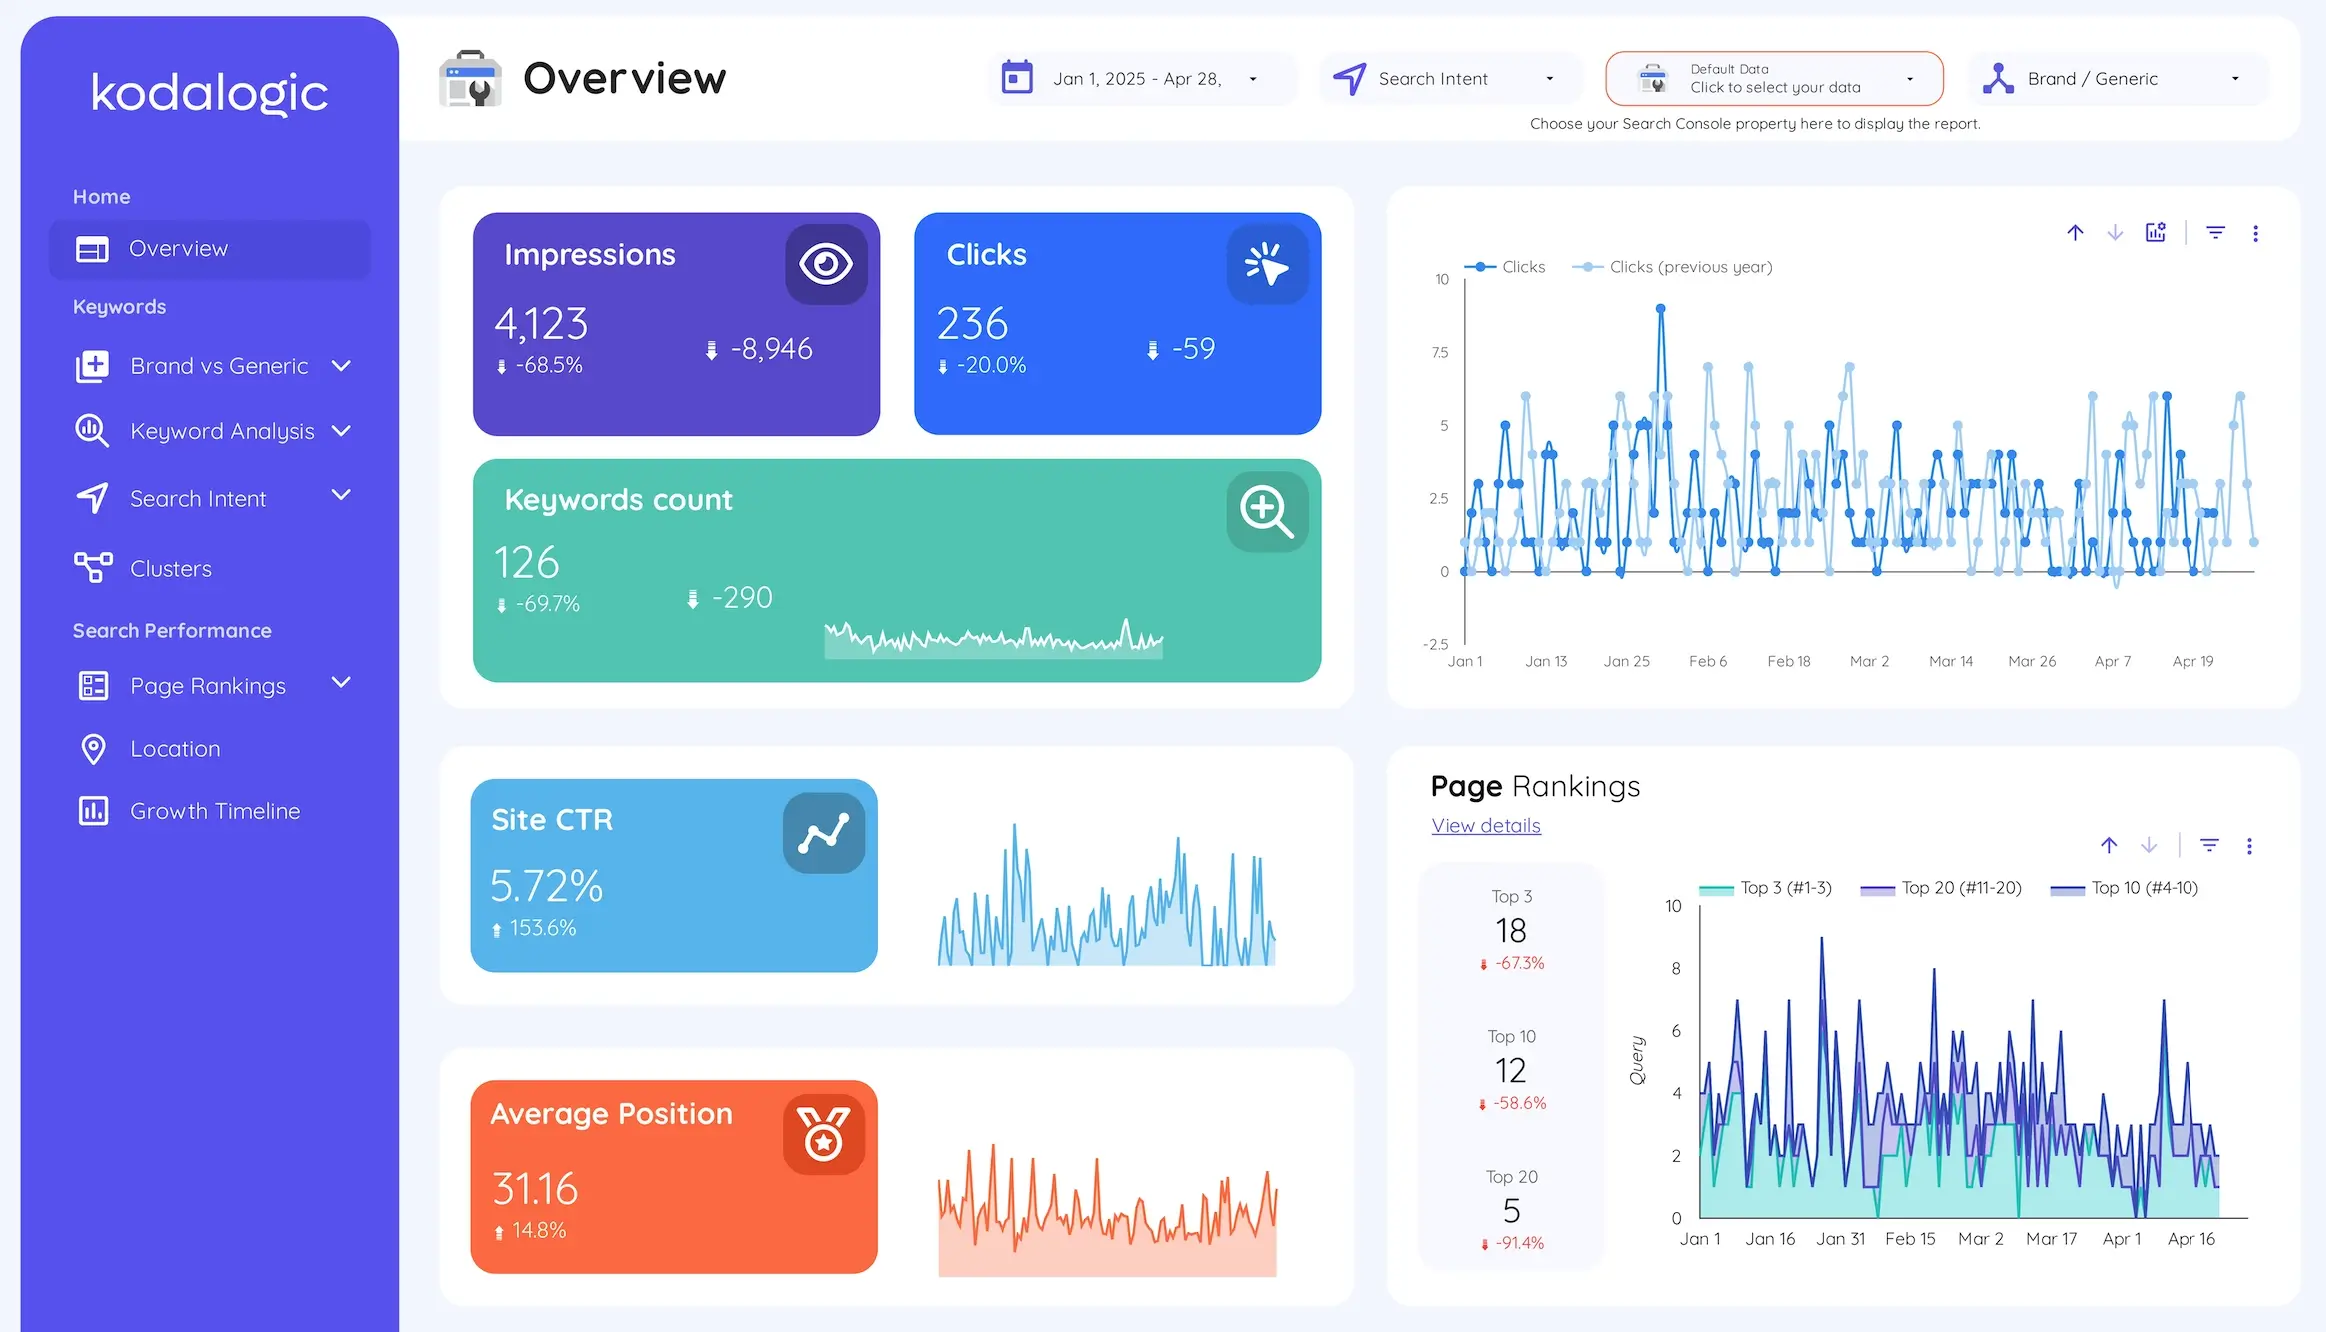
Smart Interpretations is a feature built into Kodalogic's Google Search Console dashboards. When the dashboard loads with your data, it reads what has changed since the previous period — positions, CTR, impressions, cluster performance, brand versus generic balance — and produces written analysis.
Not a chart with a trend indicator. Not a table with percentage deltas. Sentences, in plain language, explaining what changed and what it means.
Here is what that looks like in practice:
A keyword cluster related to a commercial topic moves from average position 8.3 to average position 6.1 over three weeks. Smart Interpretations does not just update the chart. It writes: this cluster gained 2.2 positions over the period — the kind of movement that typically signals a content update or link gain is working. CTR for this cluster is below position-benchmark expectations, suggesting a title tag review would generate clicks before further ranking improvement is needed.
That is a complete analysis sentence. It identifies the event, contextualizes it, and points to the next action. It was written automatically, in under one second, from your live Search Console data.
This is what makes it different from every other Looker Studio SEO dashboard on the market.
How Smart Interpretations Works
Smart Interpretations does not use a generic AI assistant sitting outside your data. It is built directly into the dashboard architecture and processes your specific Search Console property every time the dashboard refreshes.
The system evaluates several dimensions simultaneously:
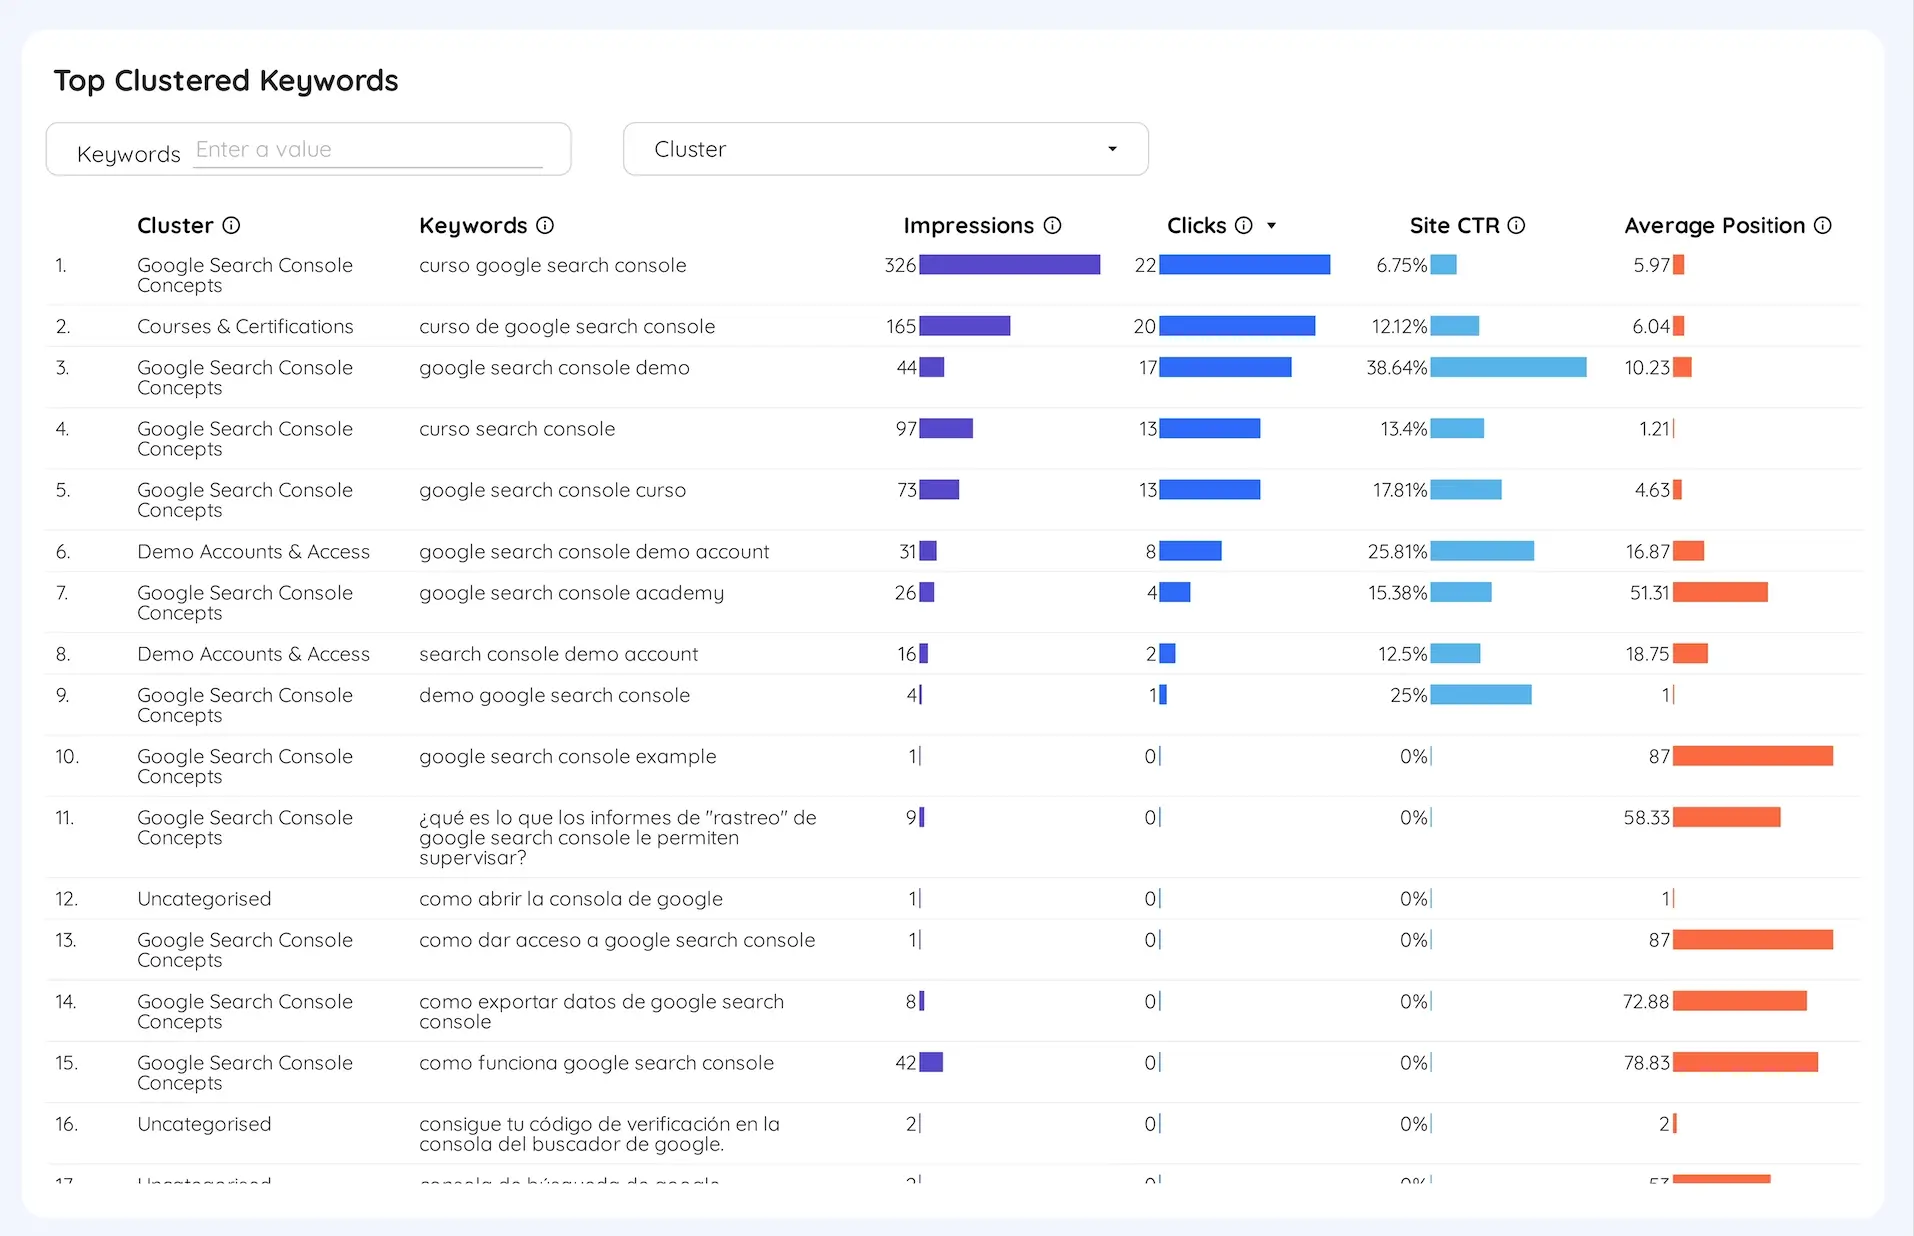
Position changes by cluster. It identifies which keyword groups gained or lost average position since the comparison period — not individual keyword fluctuations, but meaningful cluster-level movement that signals whether content strategy for that topic is working or not.
CTR gaps against position benchmarks. It compares your actual click-through rates against expected rates for each position band. A page at position 4 with 1.8% CTR when the benchmark is 6–8% has a problem that is not a ranking problem — it is a snippet problem. Smart Interpretations identifies these gaps and flags them explicitly.
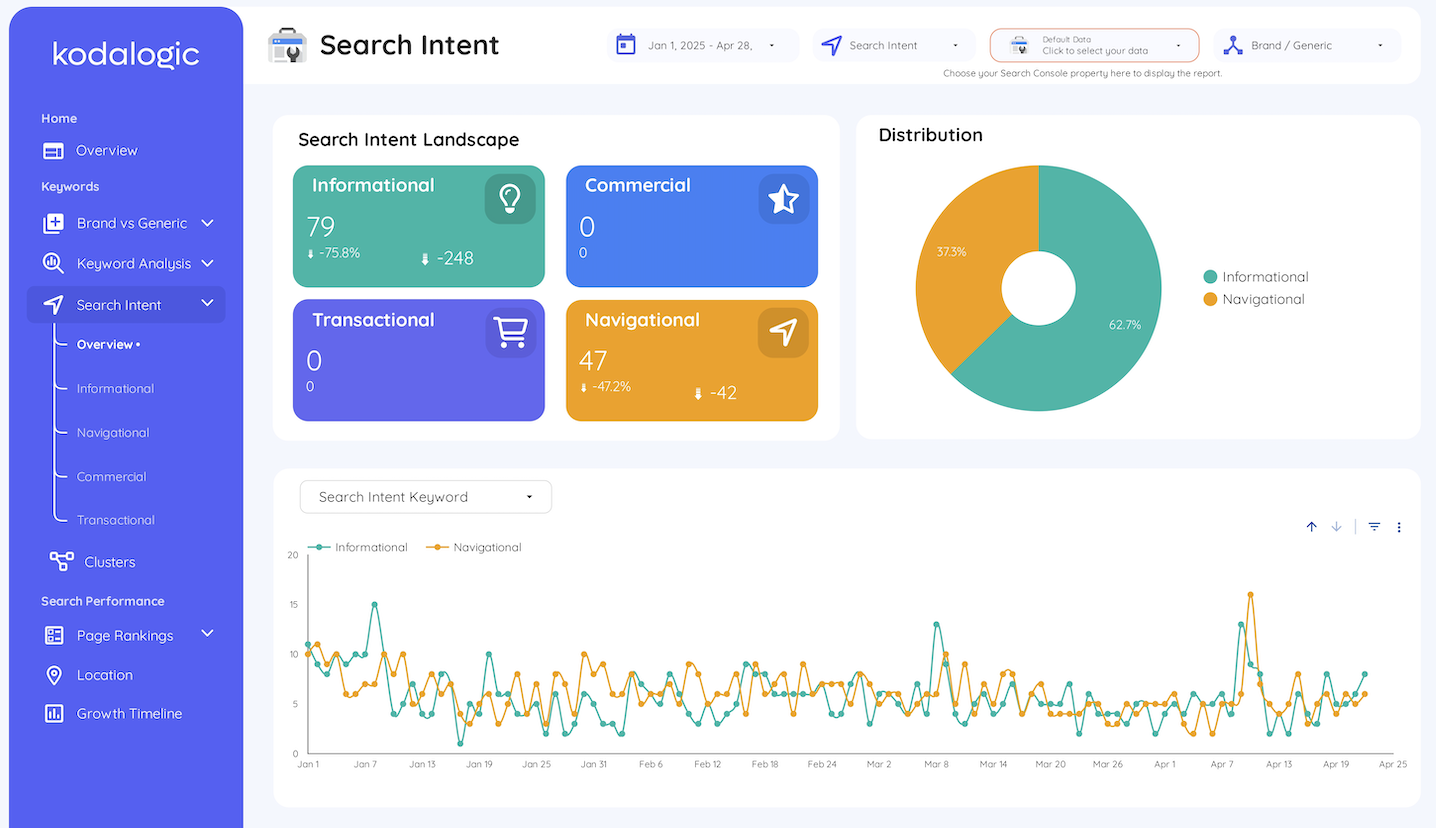
Brand versus generic visibility shifts. When the ratio between branded and non-branded impressions changes meaningfully, Smart Interpretations surfaces it. This is a signal most dashboards never even show, let alone explain. The full explanation of why this matters is in our Looker Studio SEO dashboard guide.
Ranking distribution movement. When keywords shift between position bands — more entering the top 10, fewer stuck beyond page two — Smart Interpretations identifies the shift as a concrete progress indicator, separate from average position which can mask real movement.
The analysis updates every time the dashboard refreshes. You do not trigger it, configure it, or prompt it. It runs automatically.
What Smart Interpretations Is Not
There is a category of tool that connects a general-purpose AI assistant to a data dashboard and lets you ask questions about your data. That is a useful feature. It is not what Smart Interpretations does.
General AI question-answering requires you to know what to ask. It responds to prompts. It needs a user to initiate the interaction.
Smart Interpretations does not wait for a prompt. It reads the data proactively, every time the dashboard loads, and produces analysis of what changed and what it means. The user does not ask a question. The dashboard has already answered it.
This distinction matters practically: when you open the dashboard on Monday morning, the analysis is already there. You did not have to ask for it. You did not have to write it. You did not have to sit with the charts and figure out what they mean. The interpretation work was done while the dashboard loaded.
Who It Is Built For
SEO professionals managing client reporting. The most direct use case. Smart Interpretations removes the interpretation layer from the Monday morning review. You open the dashboard, read what changed, add any context specific to that client's situation, and move to the action conversation. The analysis that would have taken twenty minutes to write manually is already there.
In-house SEO and content teams reporting upward. Smart Interpretations produces the kind of plain-language summary that makes sense to a marketing director or CMO who does not live in Search Console. You are not presenting charts that need explaining. You are sharing analysis that communicates directly.
Consultants and freelancers managing multiple properties. Scale is where Smart Interpretations creates the most leverage. Each property you manage runs the same interpretation automatically. The reporting overhead does not grow with the number of clients.
The Hours It Saves
Swydo's research on agency reporting puts manual SEO analysis at 4 to 5 hours per client per month with manual methods. With automation, that drops to 15 to 30 minutes.
Smart Interpretations does not automate the data collection — that was already handled by connecting Search Console to Looker Studio. It automates the interpretation layer on top of the data. For a ten-client agency, eliminating twenty minutes of manual analysis per client per reporting cycle recovers over three hours every month — without any change in the quality or depth of analysis delivered.
Where Smart Interpretations Is Available
Smart Interpretations is included in three Kodalogic templates — every template that connects to Google Search Console:
Google Search Console Dashboard for Looker Studio — $129, one-time The most complete GSC dashboard available. Smart Interpretations runs across all keyword analysis modules. Includes keyword intent clustering, brand versus generic segmentation, CTR gap analysis, and ranking distribution — all interpreted automatically.
Web & SEO Dashboard for Looker Studio — GA4 + Search Console — $214, one-time GA4 and Search Console in a single view. Smart Interpretations covers the Search Console side. The full guide to why combining both data sources changes what you can see is in our SEO dashboard guide.
All-in-One Marketing Dashboard for Looker Studio — $289, one-time GA4, Search Console, and Google Ads in one live report. Smart Interpretations runs on the Search Console module. Comparable templates from competitors cost up to $645 — without this feature.
All three connect to your live Search Console property in under two minutes. No coding, no connectors, no configuration. Smart Interpretations activates automatically on first load.
One More Thing
No other public Looker Studio template has Smart Interpretations. Not among the templates in Google's official gallery. Not among the products from any competitor. This is not a comparison claim that requires verification — it is simply a feature that does not exist anywhere else in the market at any price point.
The full picture of what a Looker Studio SEO dashboard should include — brand versus generic segmentation, intent classification, keyword clusters, ranking distribution — is in our complete Looker Studio SEO dashboard guide. This post covers the one part that no other guide can cover: Smart Interpretations, because only Kodalogic has it.
→ See the Google Search Console Dashboard with Smart Interpretations