15 of November of 2025
Google Ads Dashboard Looker Studio: Track ROAS & Conversions

Isaac Correa
Looker Studio Templates
Automate Google Ads reporting with Looker Studio. Real-time ROAS tracking, multi-account dashboards, zero manual work. Convert data to decisions instantly.
Google Ads Dashboard Looker Studio: Track ROAS and Conversions Like a Pro
Your Google Ads campaigns are running. Performance data is flowing in. But here's the problem most agencies face every single week: that data lives inside Google Ads, scattered across campaign reports, locked inside conversion tabs, and practically impossible to present to clients without spending hours building custom reports.
You need answers fast. Your clients want clarity. Your team needs actionable insights. Yet instead, you're exporting spreadsheets, manually plugging numbers into PowerPoint slides, and losing hours every month just to show what your ads are actually doing.
There's a better way to handle this.
Why Google Ads Reporting Currently Takes Forever
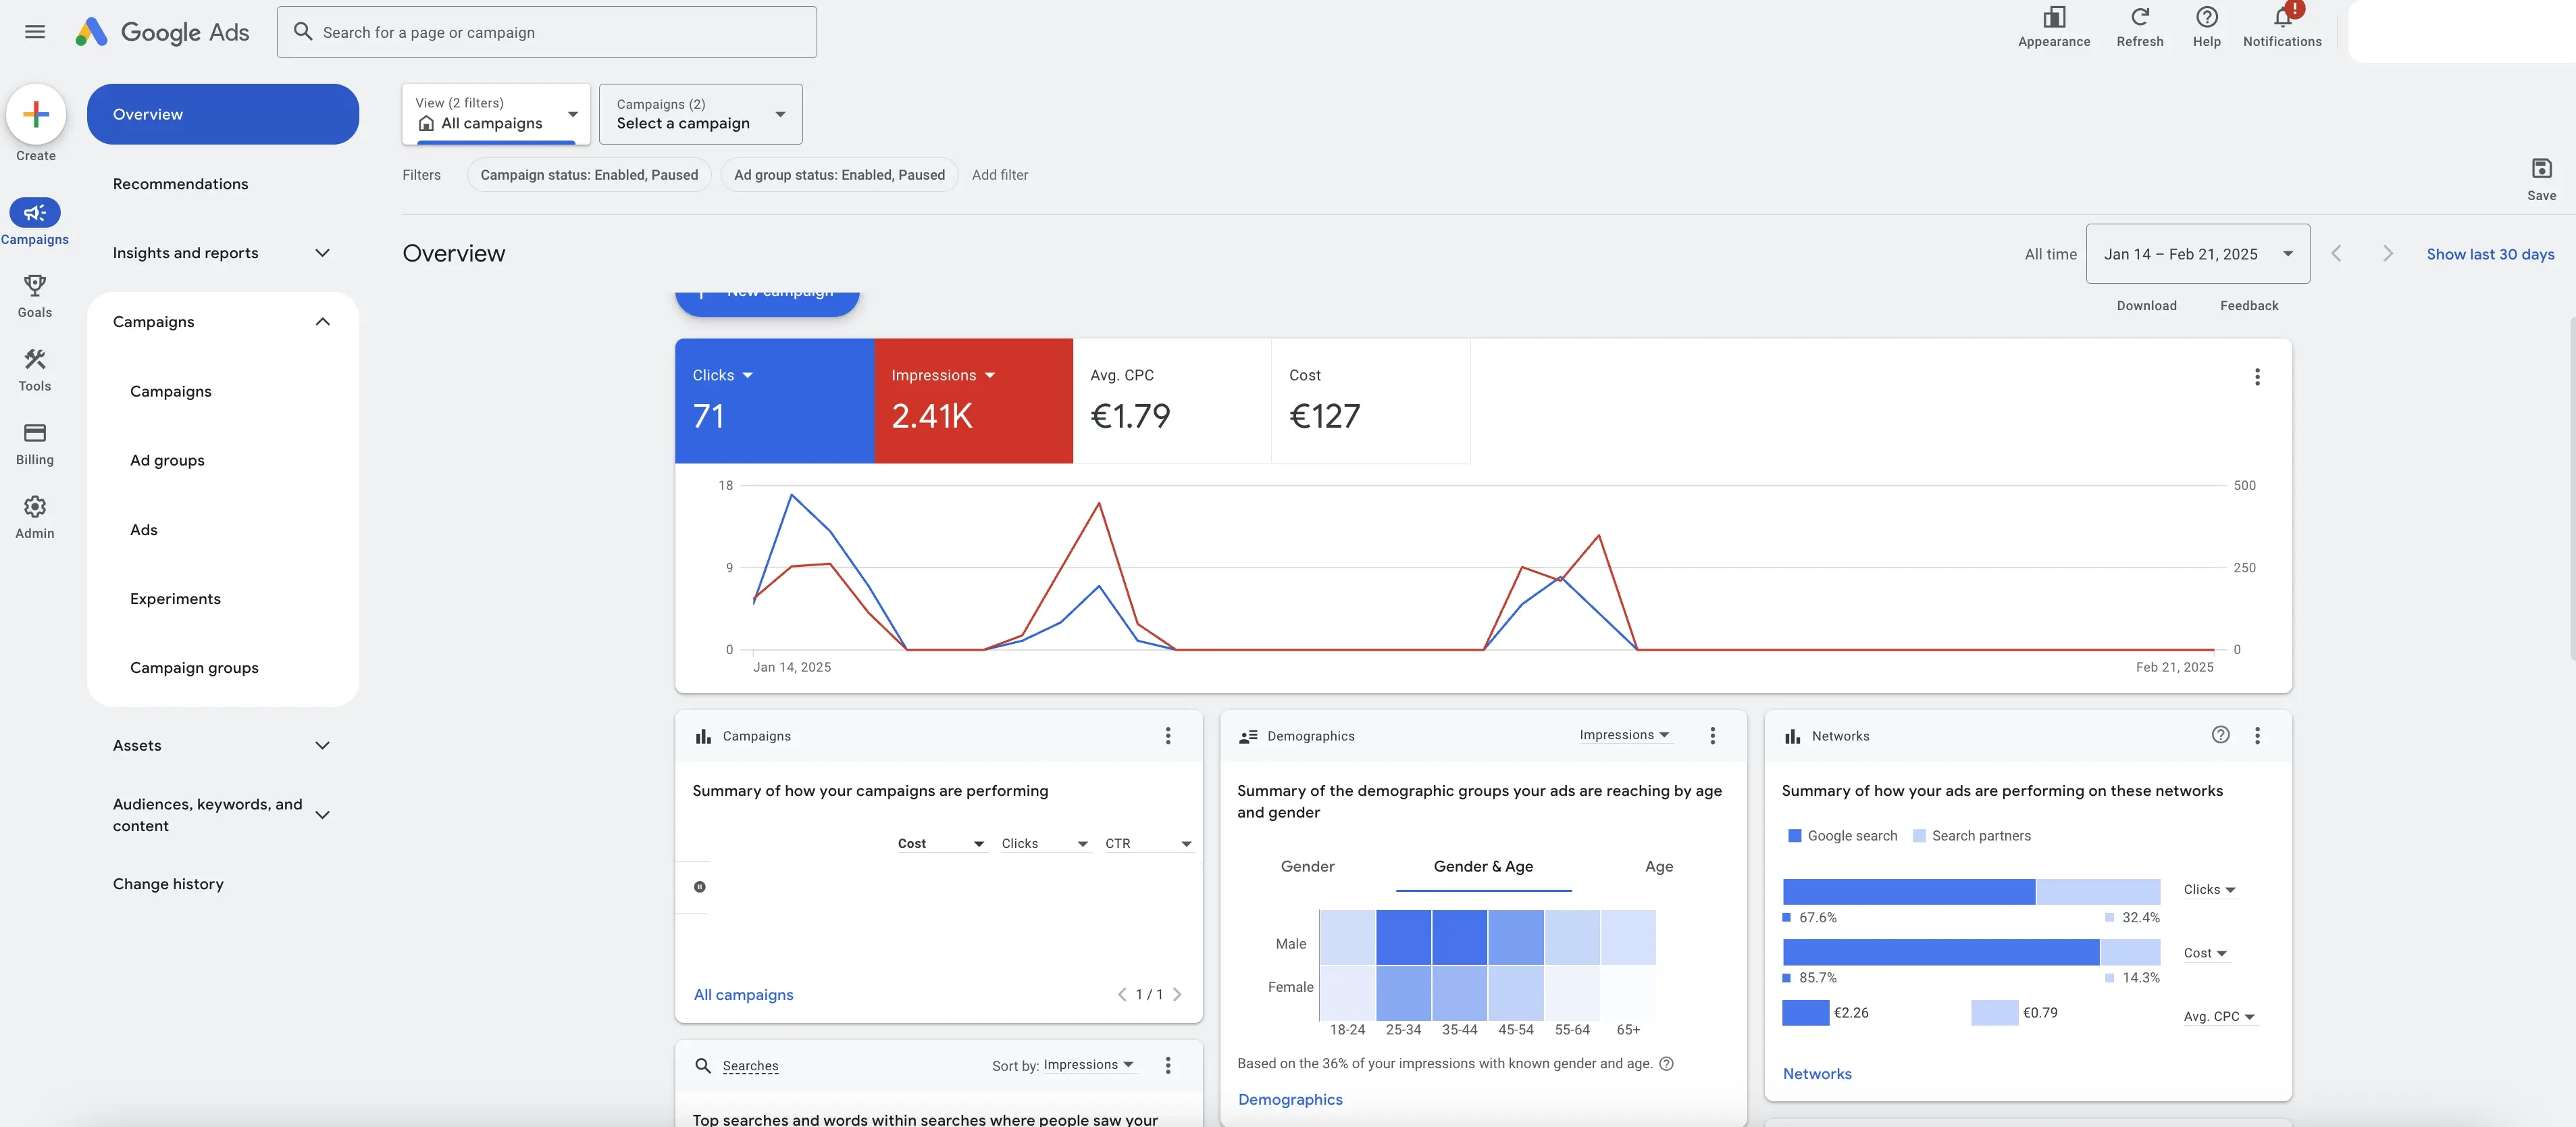
Open Google Ads and navigate to your account. You're looking at campaign-level data. But to understand the full picture, you need to jump between multiple reports. Check conversion data in one place. ROAS calculations in another. Geographic performance somewhere else. Keyword breakdowns in yet another location.
This fragmentation is exactly why manual Google Ads reporting wastes so much time. By the time you've collected all the pieces, compiled them into something presentable, and explained what the metrics actually mean, hours have evaporated. This happens every single reporting cycle.
Research from Google's own documentation shows that the average cost per lead in Google Ads in 2024 is $66.69, with variation ranging from $27.94 in automotive repair to $144.03 in legal services. Yet most agencies struggle to even communicate these numbers clearly to their clients without getting lost in spreadsheets.
The real challenge isn't understanding the metrics. It's accessing them efficiently and presenting them in ways clients actually understand.
Consider what's currently happening in your workflow. You spend Monday morning exporting data. Tuesday is spent formatting and calculating. Wednesday arrives and you're still tweaking charts. By Thursday, when you finally deliver the report, the numbers are already four days old. Your clients need insights in real time, not historical data that came together through manual labor.
What Modern Google Ads Reporting Actually Requires
Building a dashboard that answers the right questions means understanding what stakeholders really need from your data. It's not about listing every possible metric. It's about highlighting the performance indicators that actually drive decisions.
Every Google Ads report worth publishing should answer these fundamental questions:
What percentage of clicks converted to customers, and at what cost? Understanding your conversion rate and cost per acquisition tells you whether your targeting is precise enough. The average ROAS for Google Ads is around 200% (2:1), meaning $2 earned for every $1 spent, but performance varies widely by industry with ranges from 0.7x in financial services to 6.86x in heavy equipment.
Which campaigns actually generate profitable revenue? Not all campaigns perform equally. Some keywords convert at premium rates. Others drain budget without results. You need visibility into which campaigns deserve more investment and which ones need pausing.
Where is your budget going, and what return is each channel producing? Ad spend matters less than return on that spend. Breaking down performance by channel, device type, and geographic region shows you exactly where efficiency lives.
How do demographic segments perform differently? Age, gender, geography, and device type all influence conversion patterns. Over 7,000 advertisers analyzed showed that fashion accessories declined in ROAS by 2.48% while toys and hobbies increased 7.01% during the holiday season, demonstrating how competition and seasonality heavily influence performance.
Is performance trending upward or downward? Historical comparison reveals whether your optimizations are working or if market conditions are changing. Week-over-week and month-over-month analysis provides this clarity.
Building a dashboard around these questions transforms how agencies operate. Instead of spending hours explaining numbers, you're showing clients exactly what's working, what needs adjustment, and where budget should flow next.
The Multi Account Reality for Agencies
Agencies manage multiple client accounts. Each client has different campaign structures, budget allocations, and performance targets. Yet most reporting solutions force you into manual workarounds.
Managing Google Ads across multiple accounts creates specific challenges:
Consolidating data from separate Google Ads accounts without accidentally mixing metrics becomes error prone. Switching between accounts takes time. Comparing performance across clients or identifying best practices becomes nearly impossible without a unified view.
Creating individual dashboards for each client seems logical until you realize you're building the same dashboard over and over. Any structural change means updating multiple versions. Maintenance becomes a nightmare.
Scaling client reporting without proportionally scaling your team's workload seems impossible when every report is built manually. Yet agencies continue accepting this limitation because they don't realize alternatives exist.
This is precisely where dashboard automation changes the game. Multi account dashboards show performance across all your clients simultaneously. You spot trends instantly. You identify which strategies work across multiple accounts. You optimize faster because you're not rebuilding reports monthly.
The Google Ads Dashboard Framework That Works
An effective dashboard structures information around how decisions actually get made. Here's what professionals use.
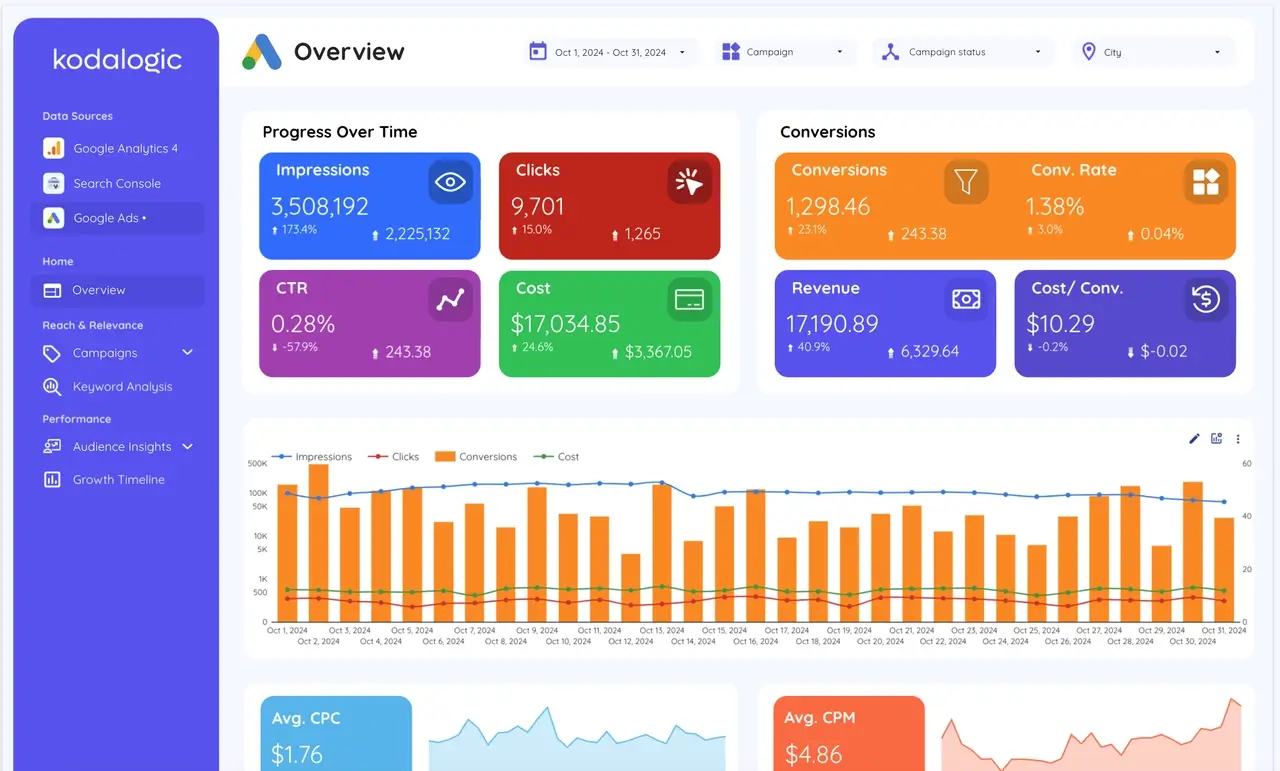
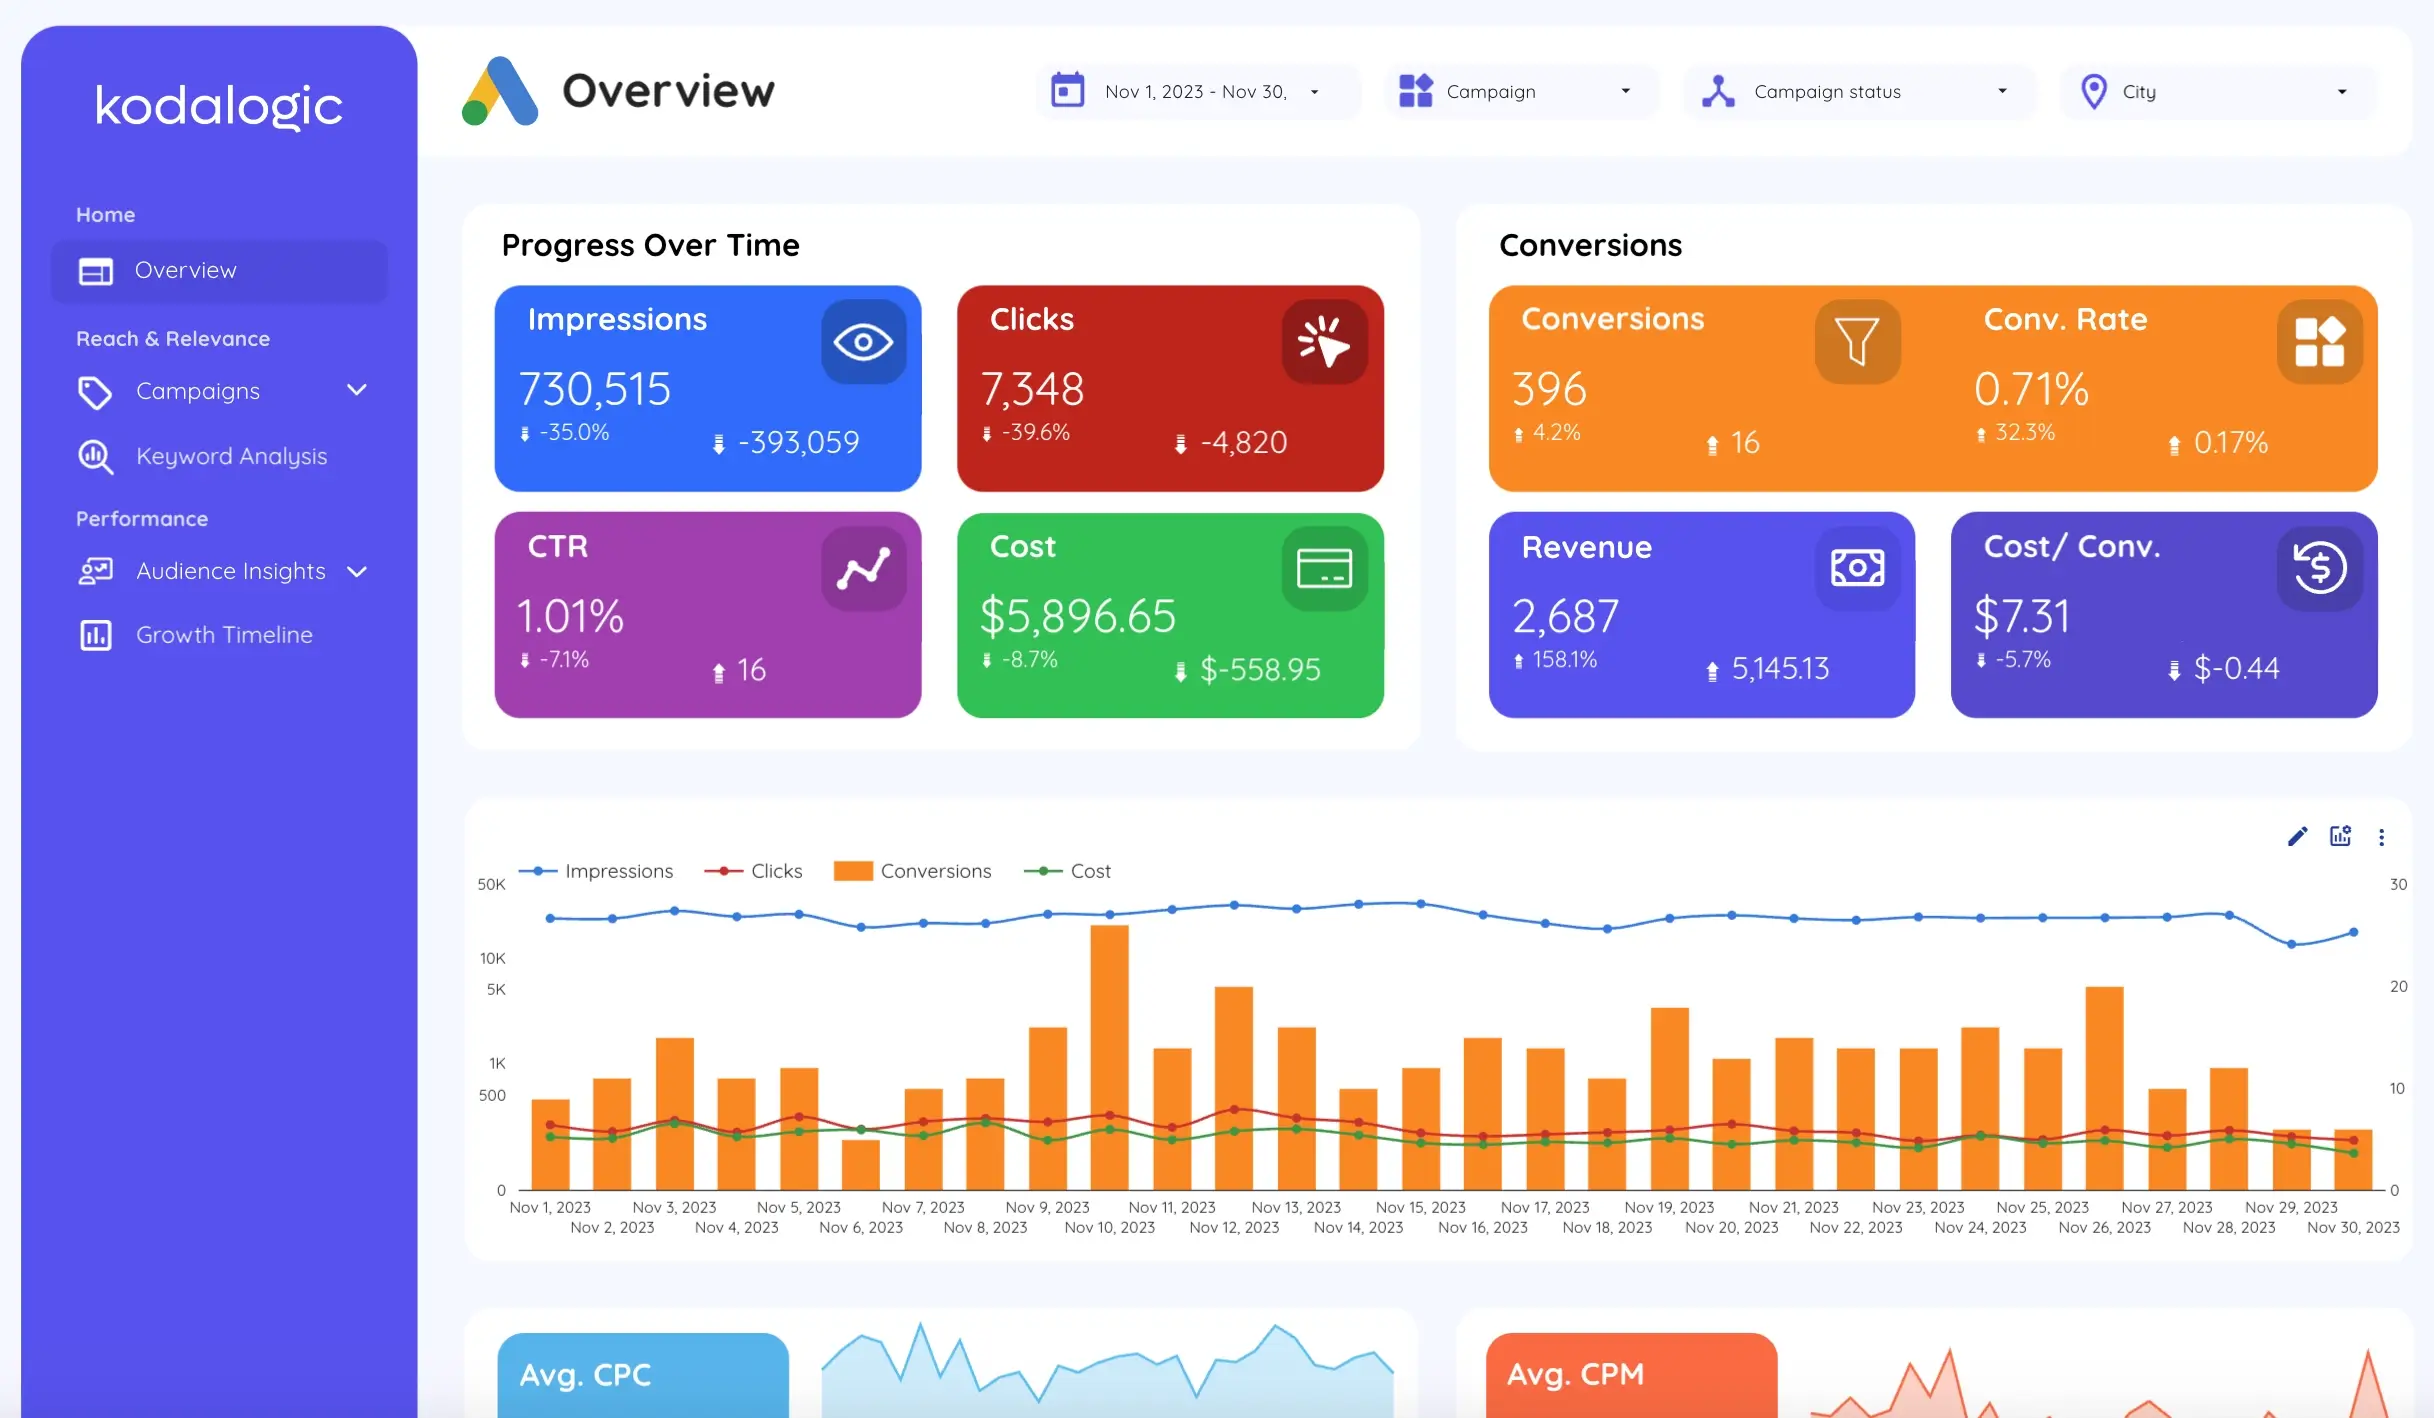
The overview section provides immediate clarity. Total ad spend across campaigns, aggregated conversions, and overall ROAS appear at the top. Key performance indicators live here: what did we spend, what did we get back? Executives and busy stakeholders get answers in seconds. This section also shows performance trends so you can instantly see whether metrics are improving or declining.
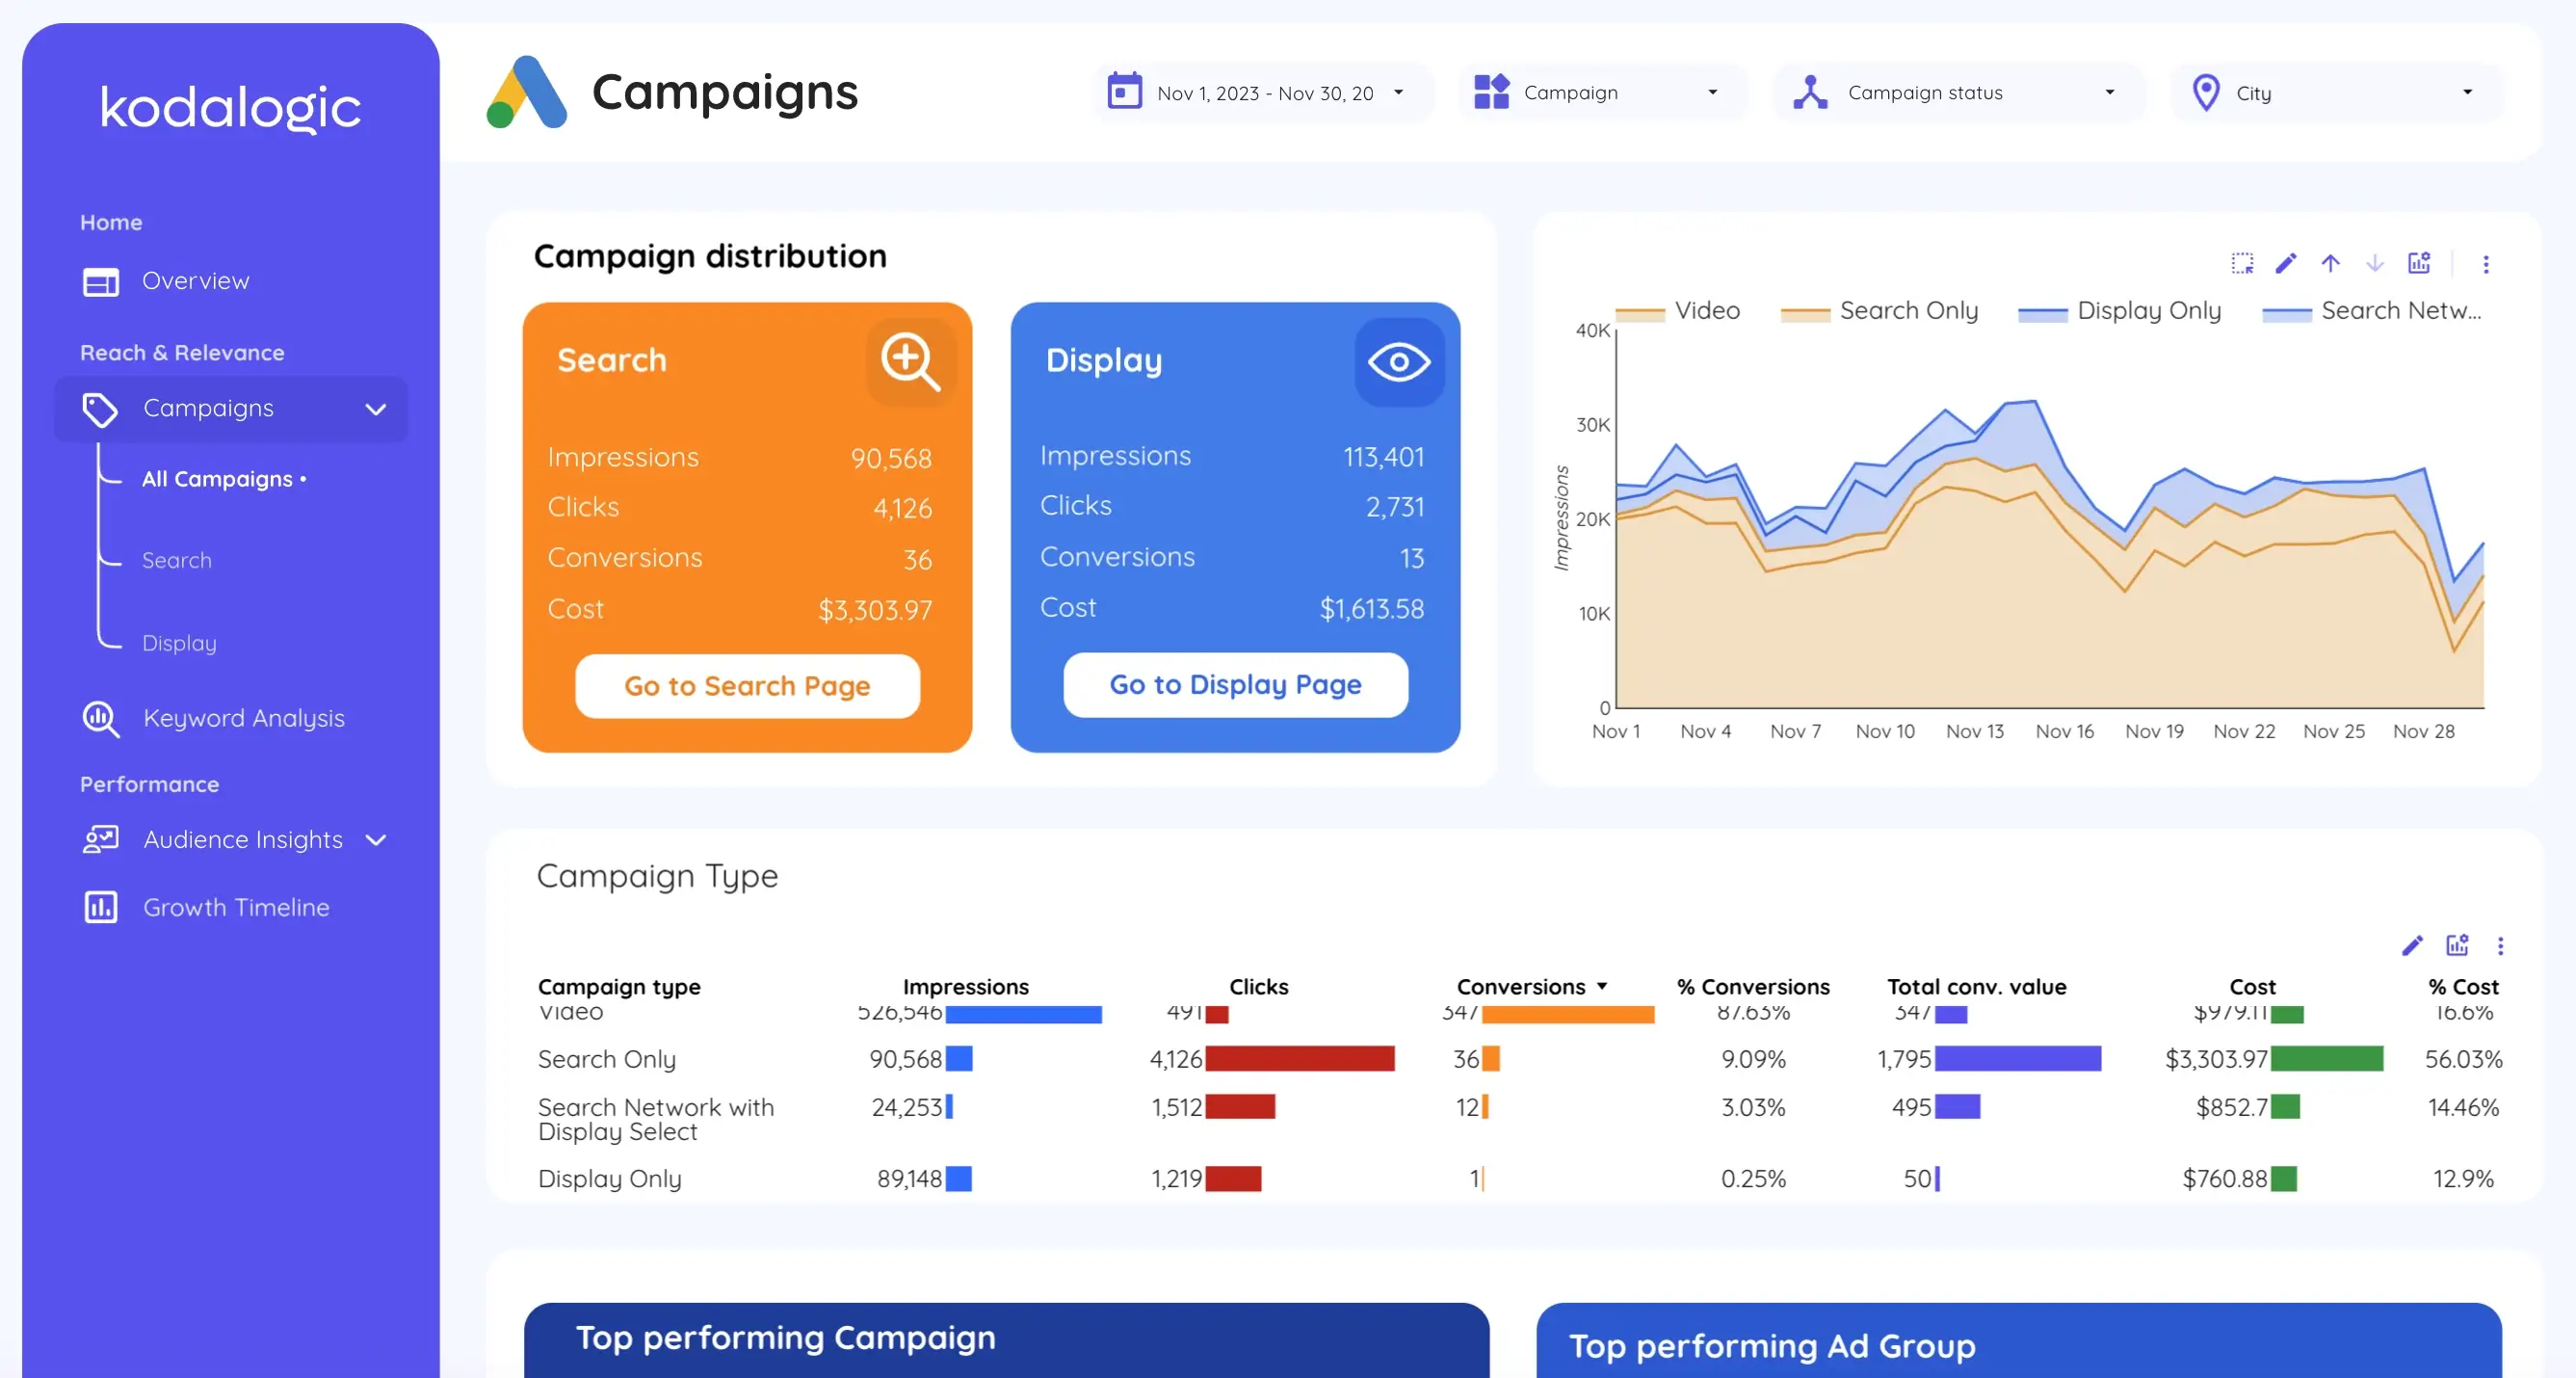
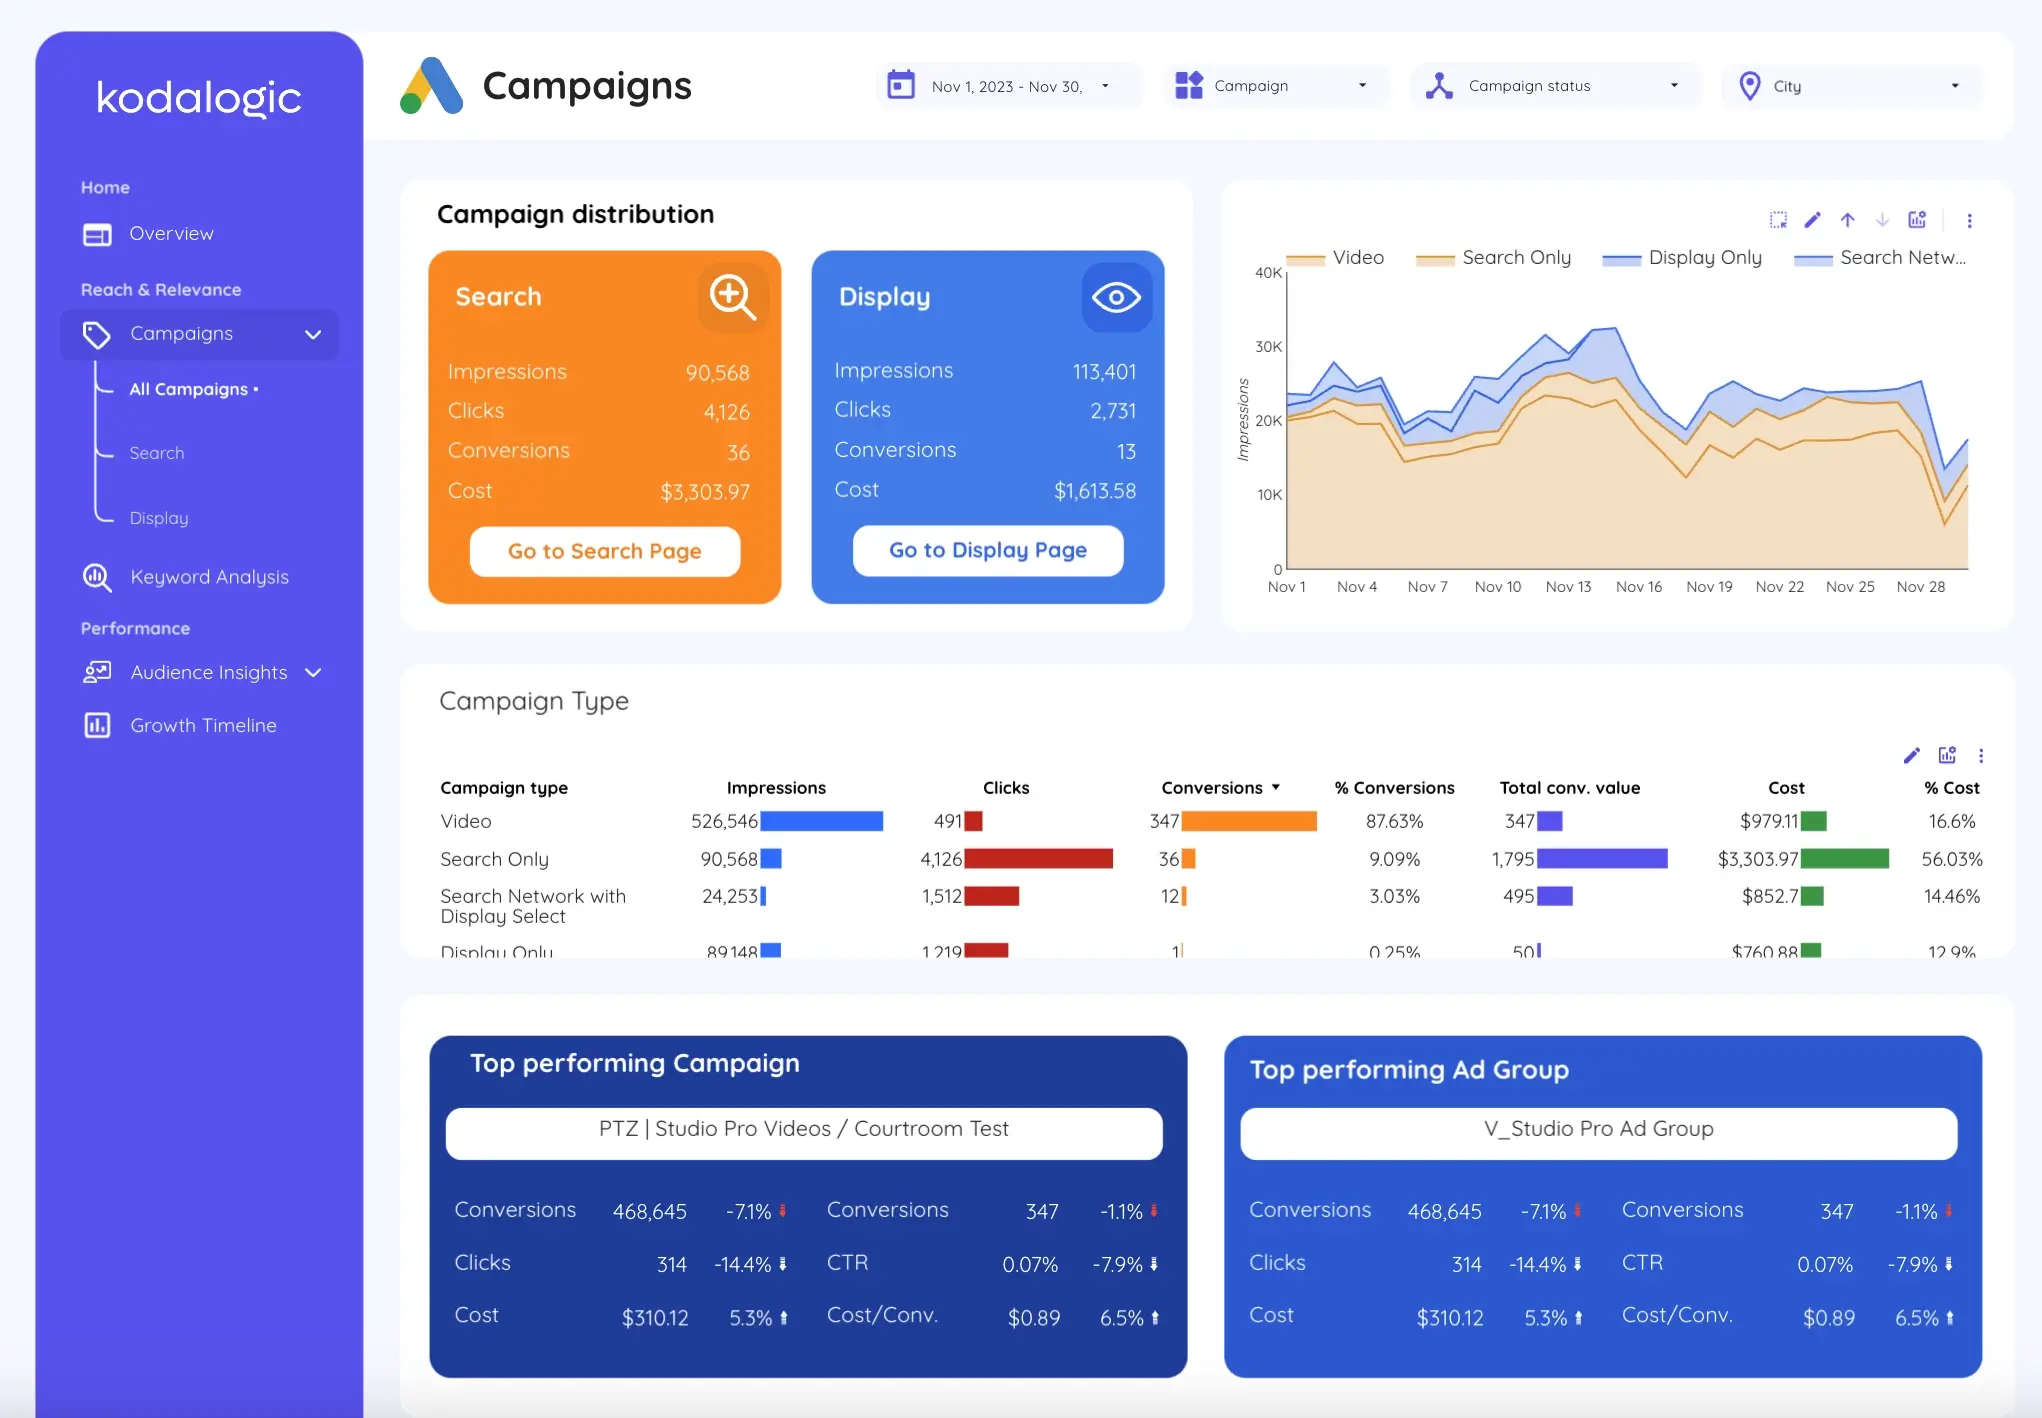
Campaign performance analysis dives into tactical details. Here you see individual campaign metrics: impressions, clicks, click through rate, conversions, cost per conversion, and return on ad spend. Which campaigns drive the best results? Which ones are underperforming? Charts comparing campaigns side by side make this comparison obvious. This is where optimization opportunities emerge.
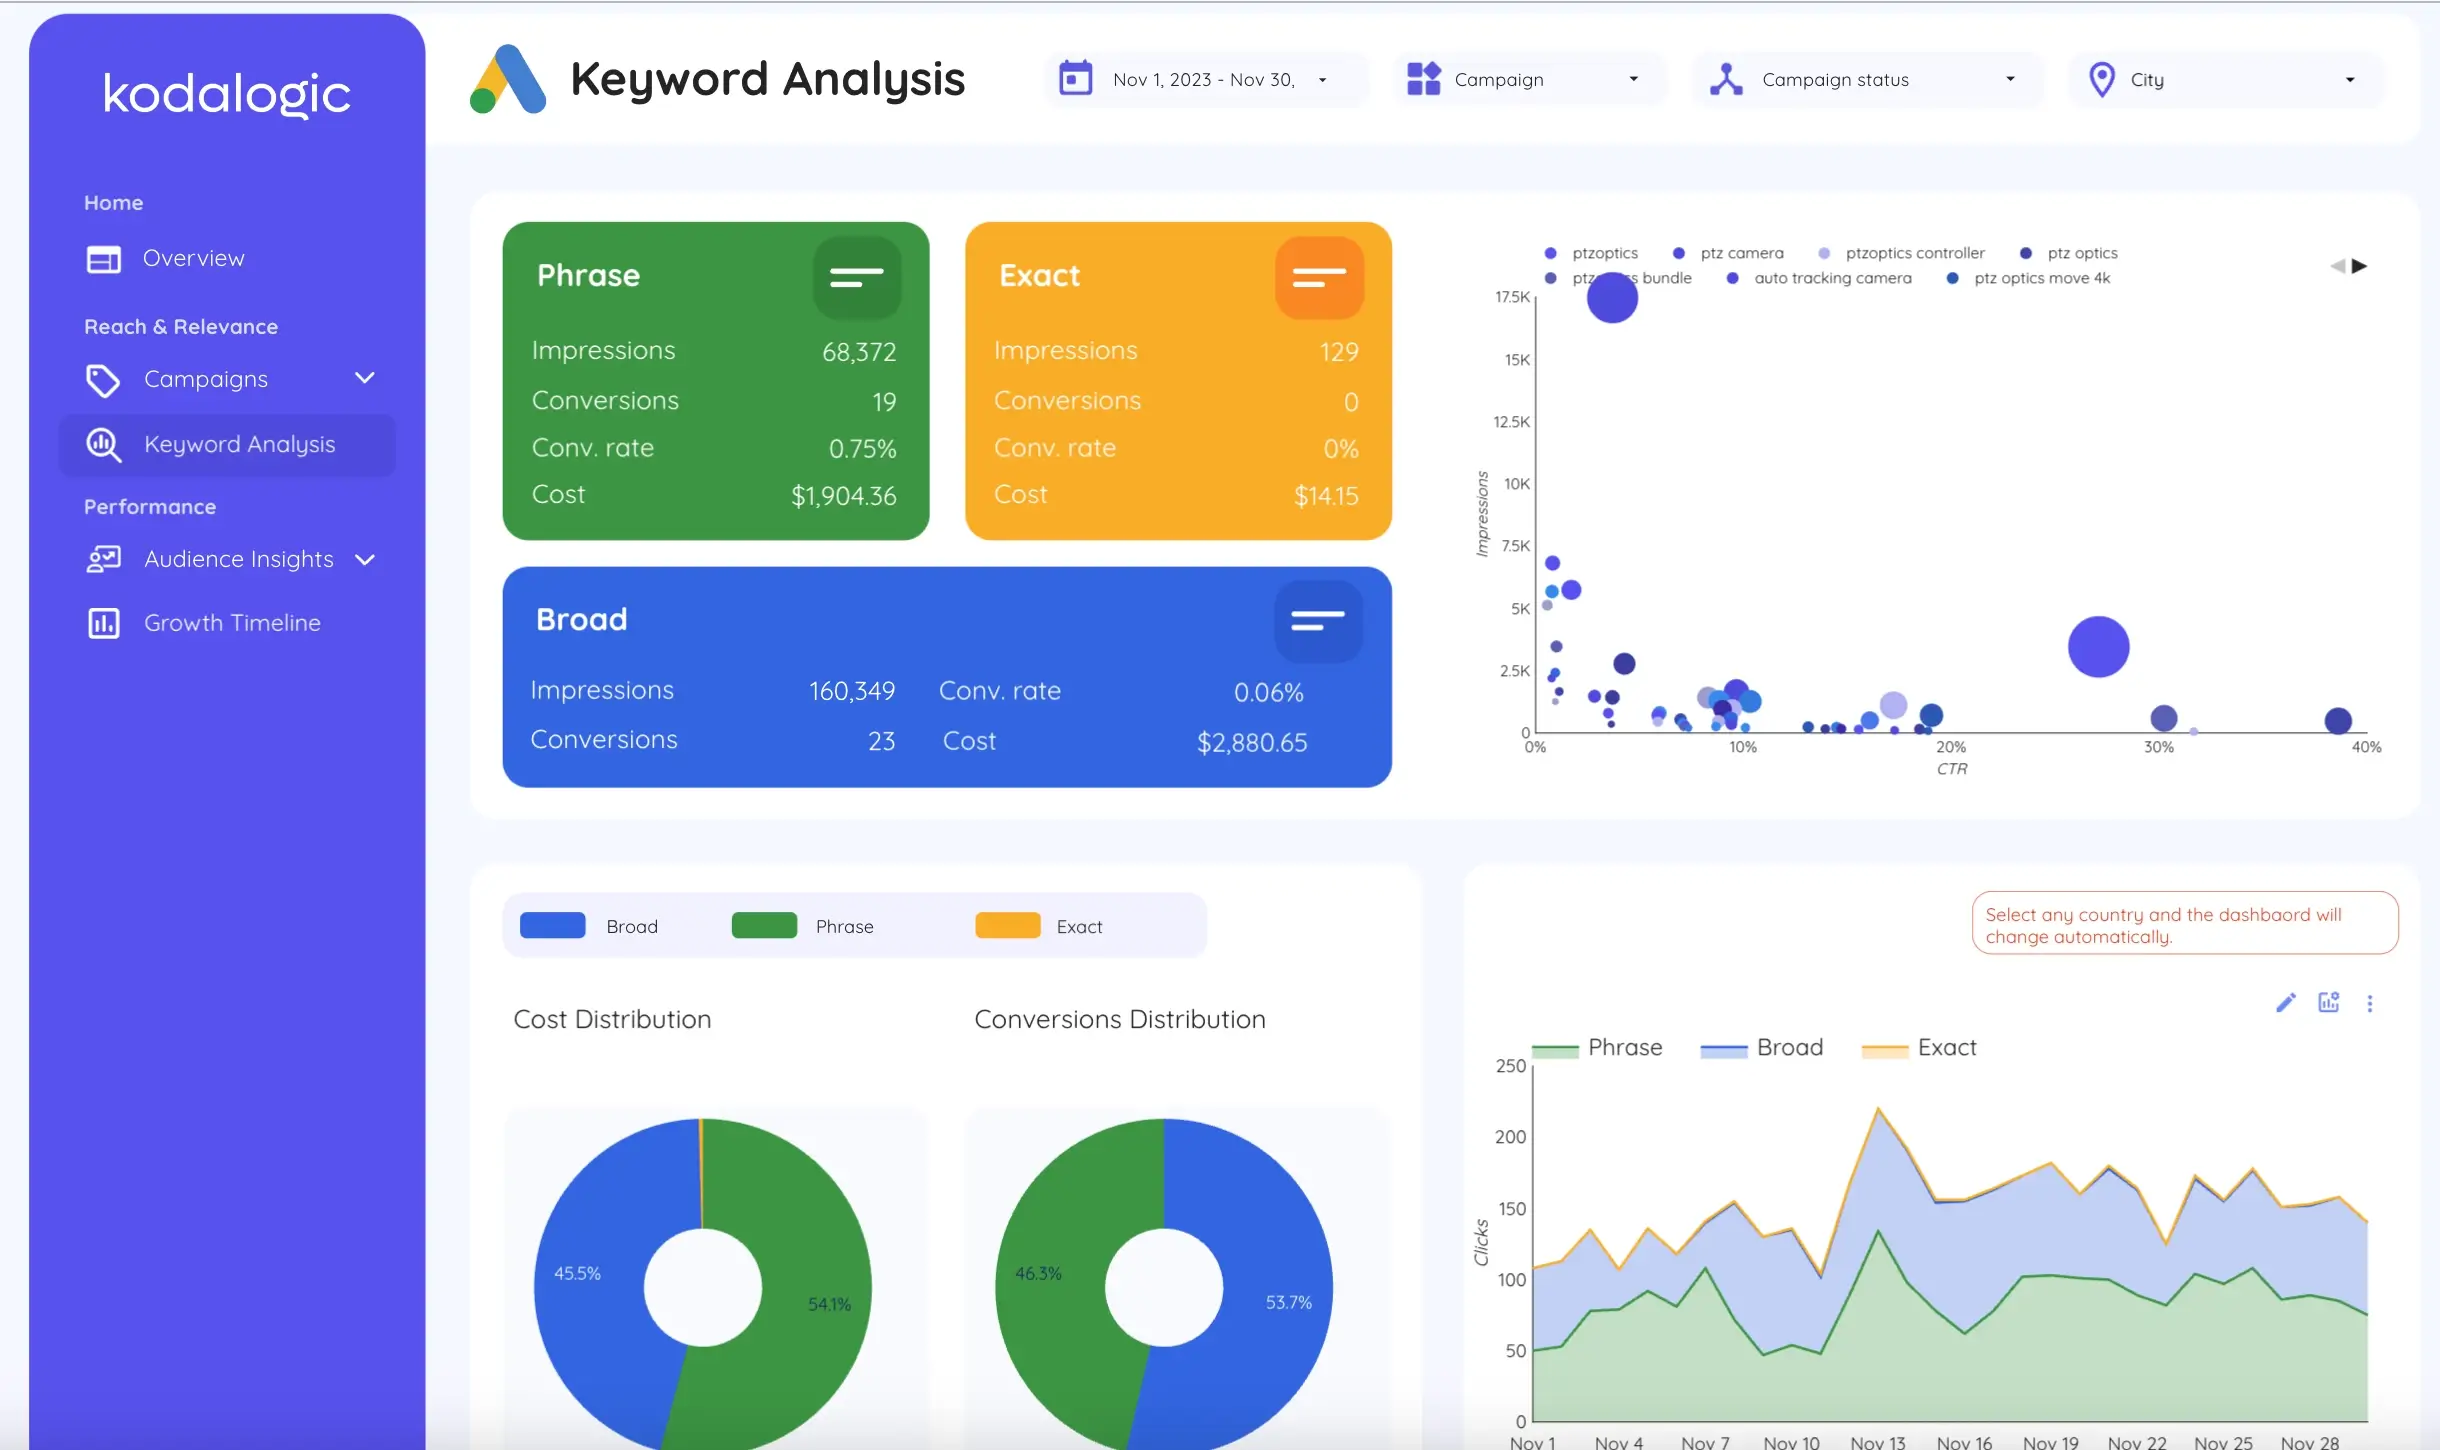
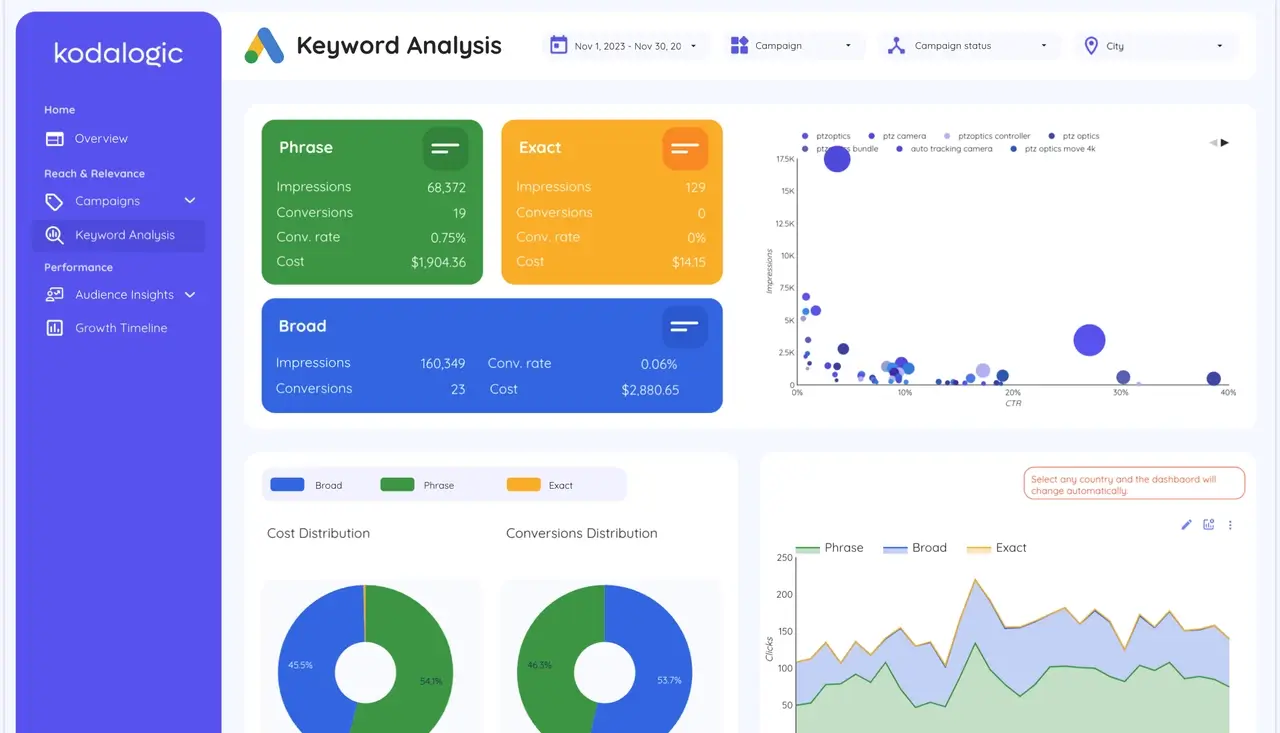
Keyword performance tracking shows which search terms actually convert. Top performing keywords, their search volume, click rates, cost per click, and conversion data all appear together. This section answers which keywords justify bid increases and which ones need pausing. It's the foundation for ongoing keyword optimization.
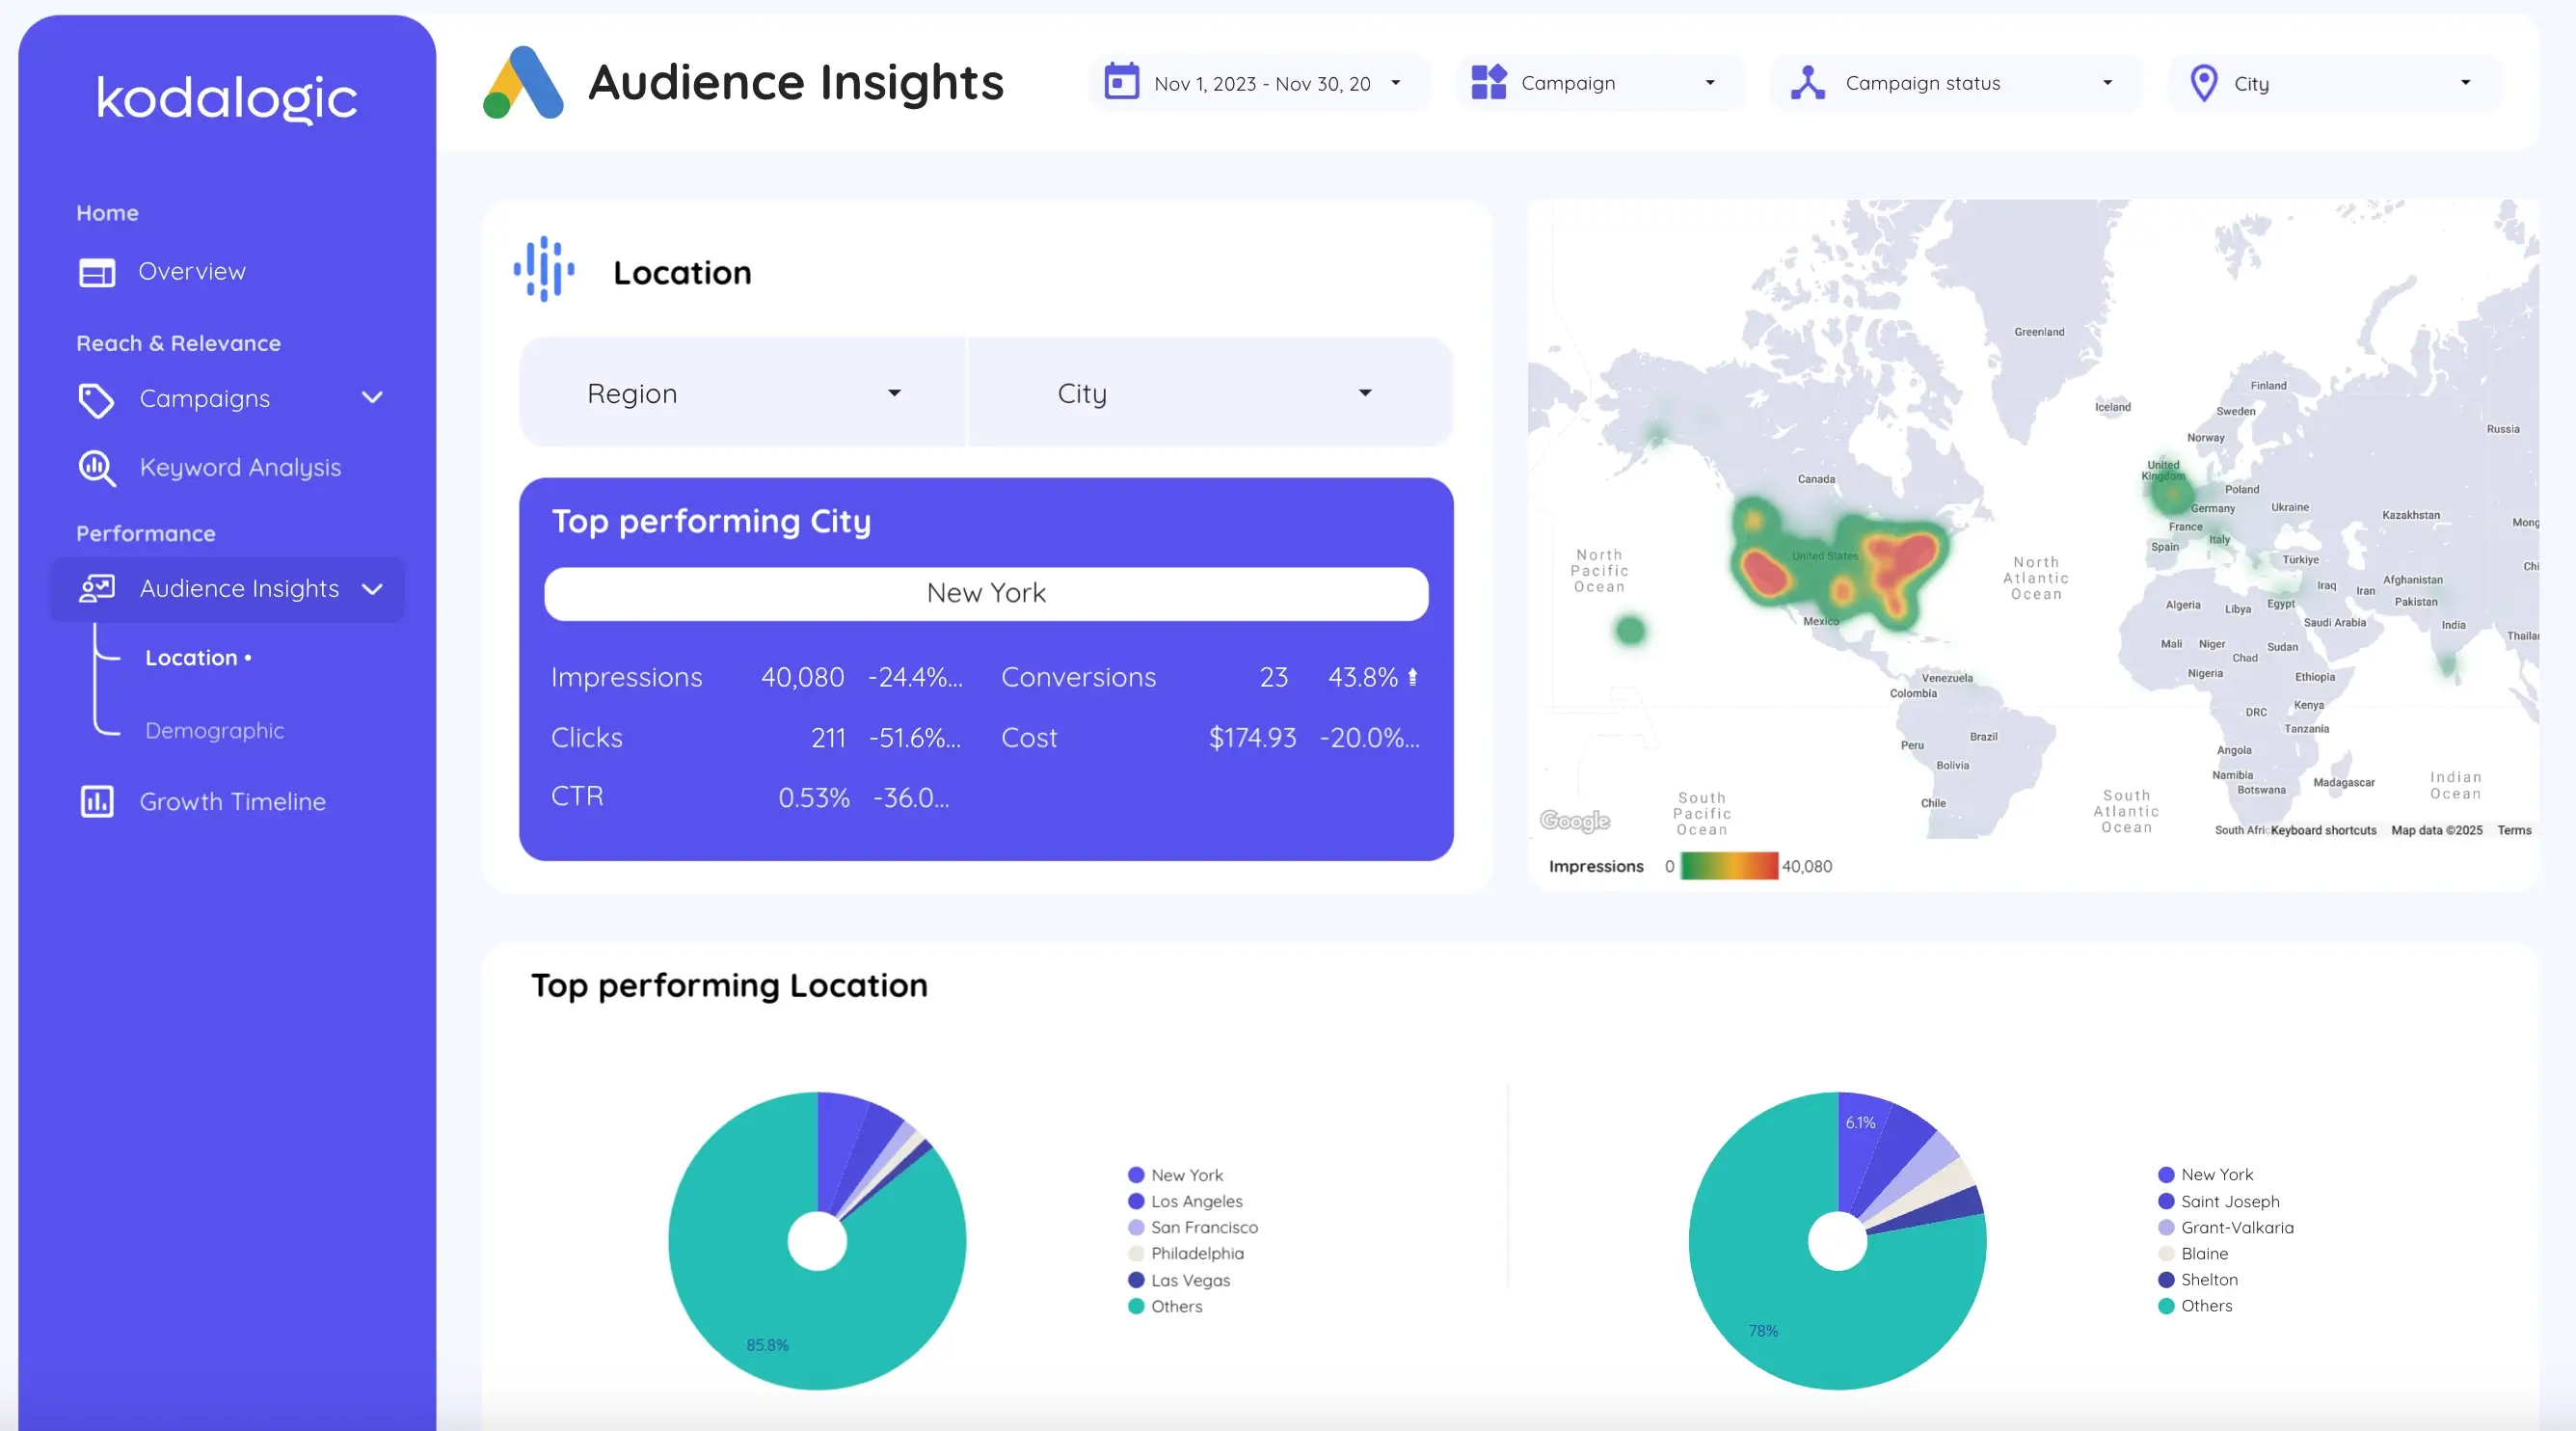
Geographic and device breakdown reveals audience behavior patterns. Where do your conversions come from? How does performance differ between mobile and desktop? These insights inform targeting adjustments. If mobile converts at lower rates, bid adjustments shift budget toward higher performing devices. If certain geographic regions outperform others, you increase focus there.
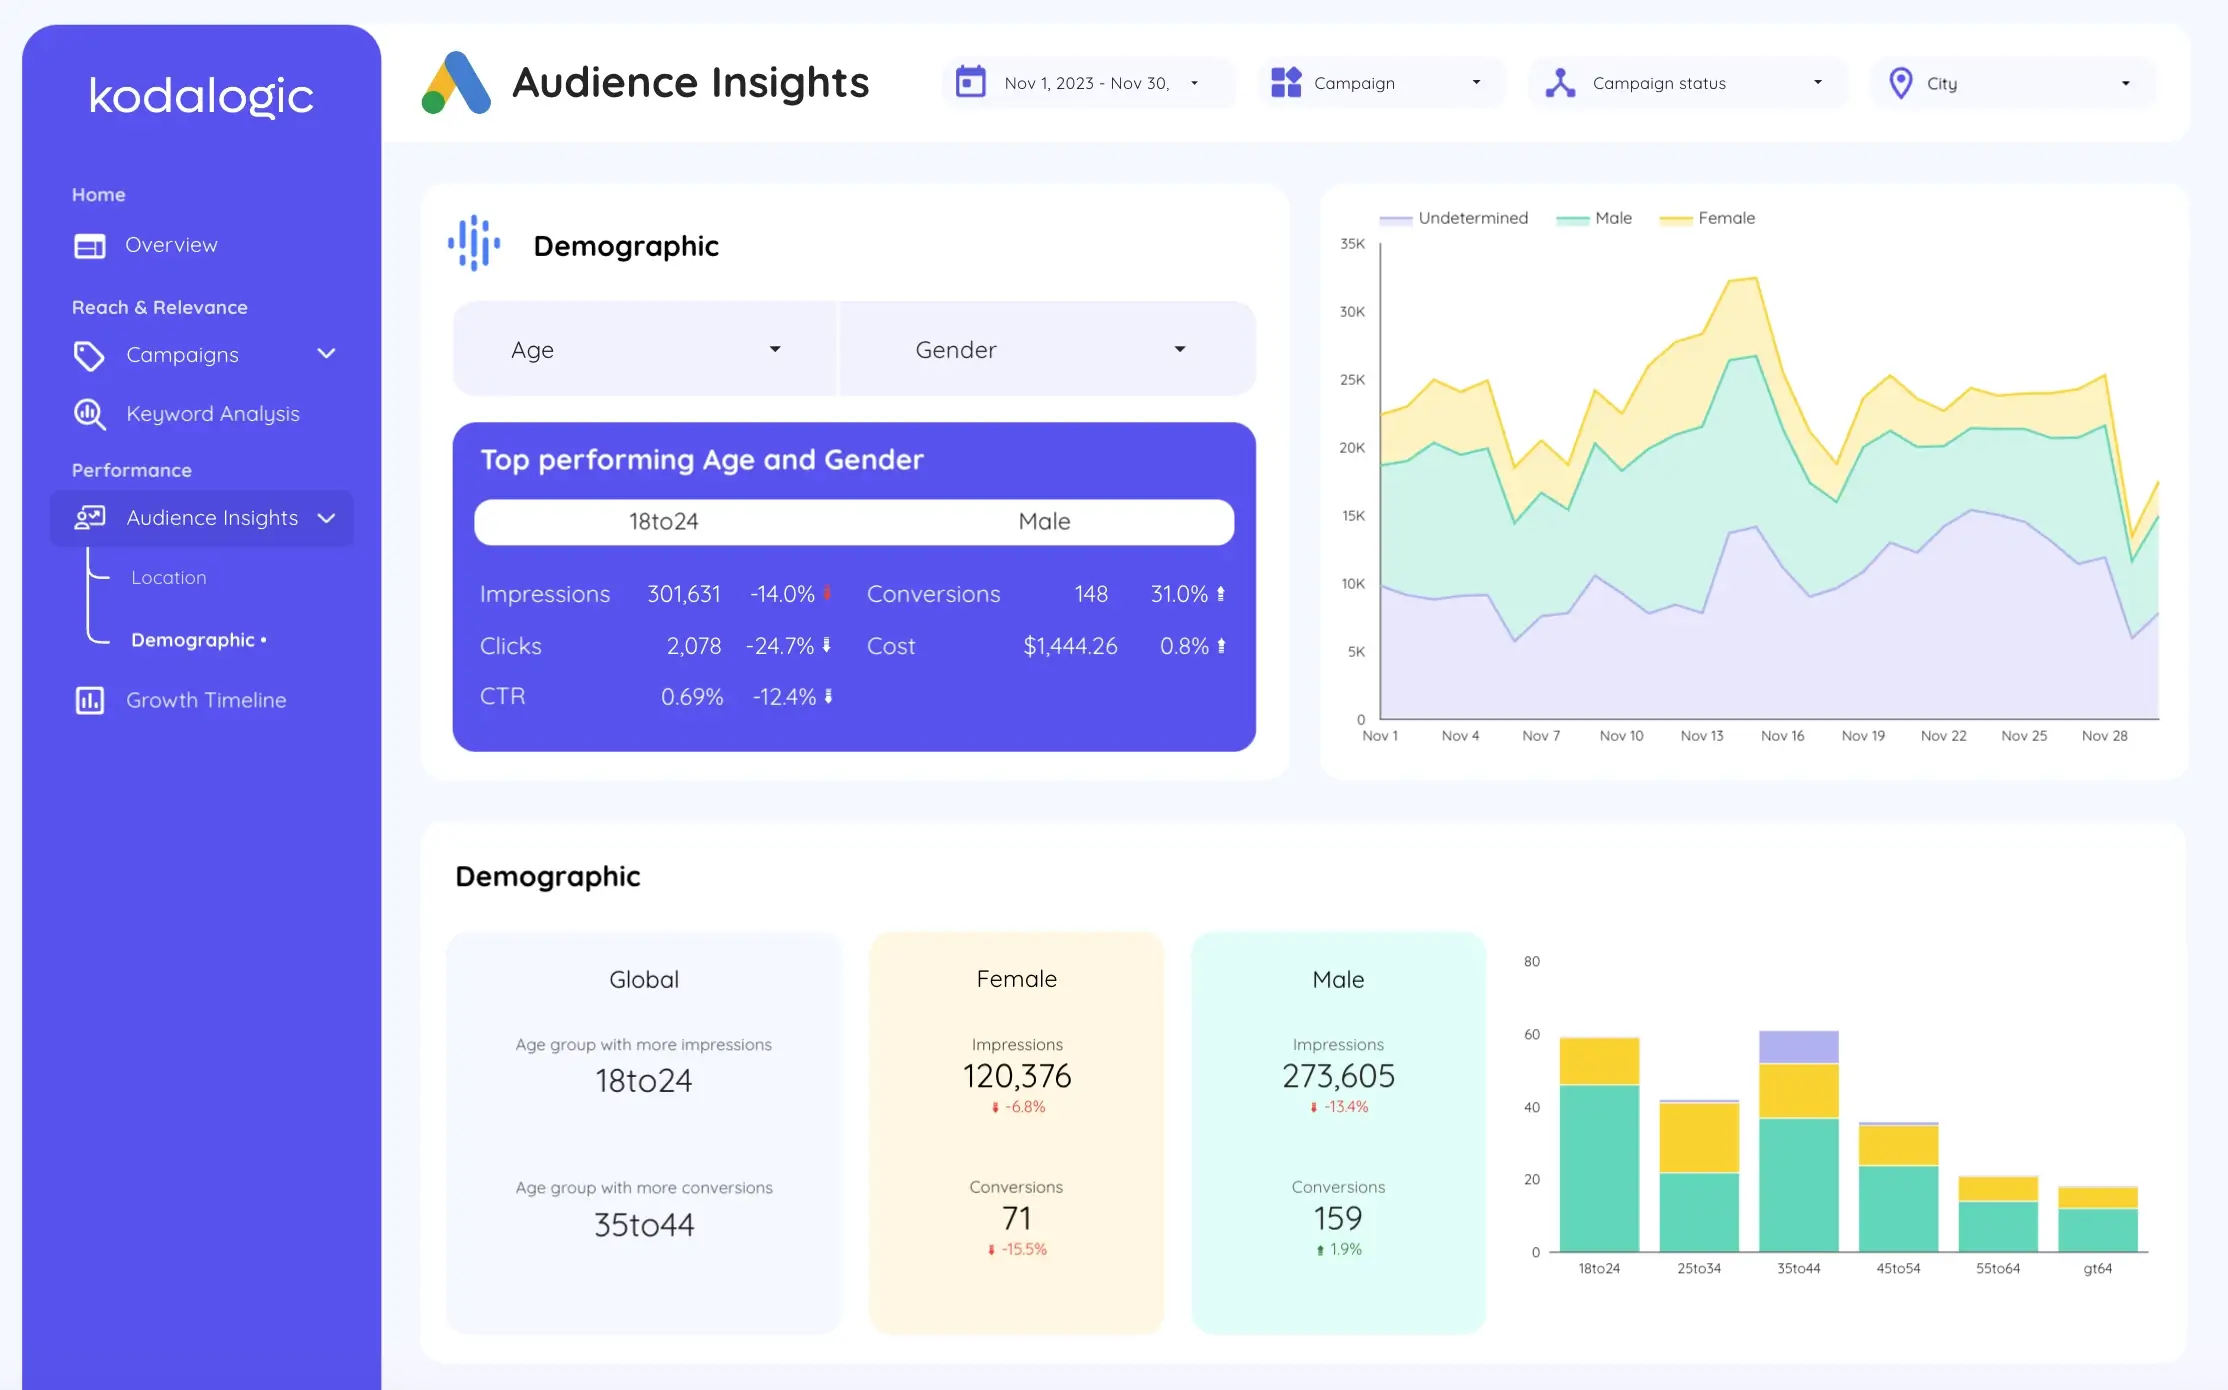
Audience demographic analysis highlights which segments drive your best results. Age, gender, and interest category breakdowns show where conversions cluster. This shapes messaging strategy and creative decisions. B2B services targeting law firms look different from B2C retail targeting teenagers.
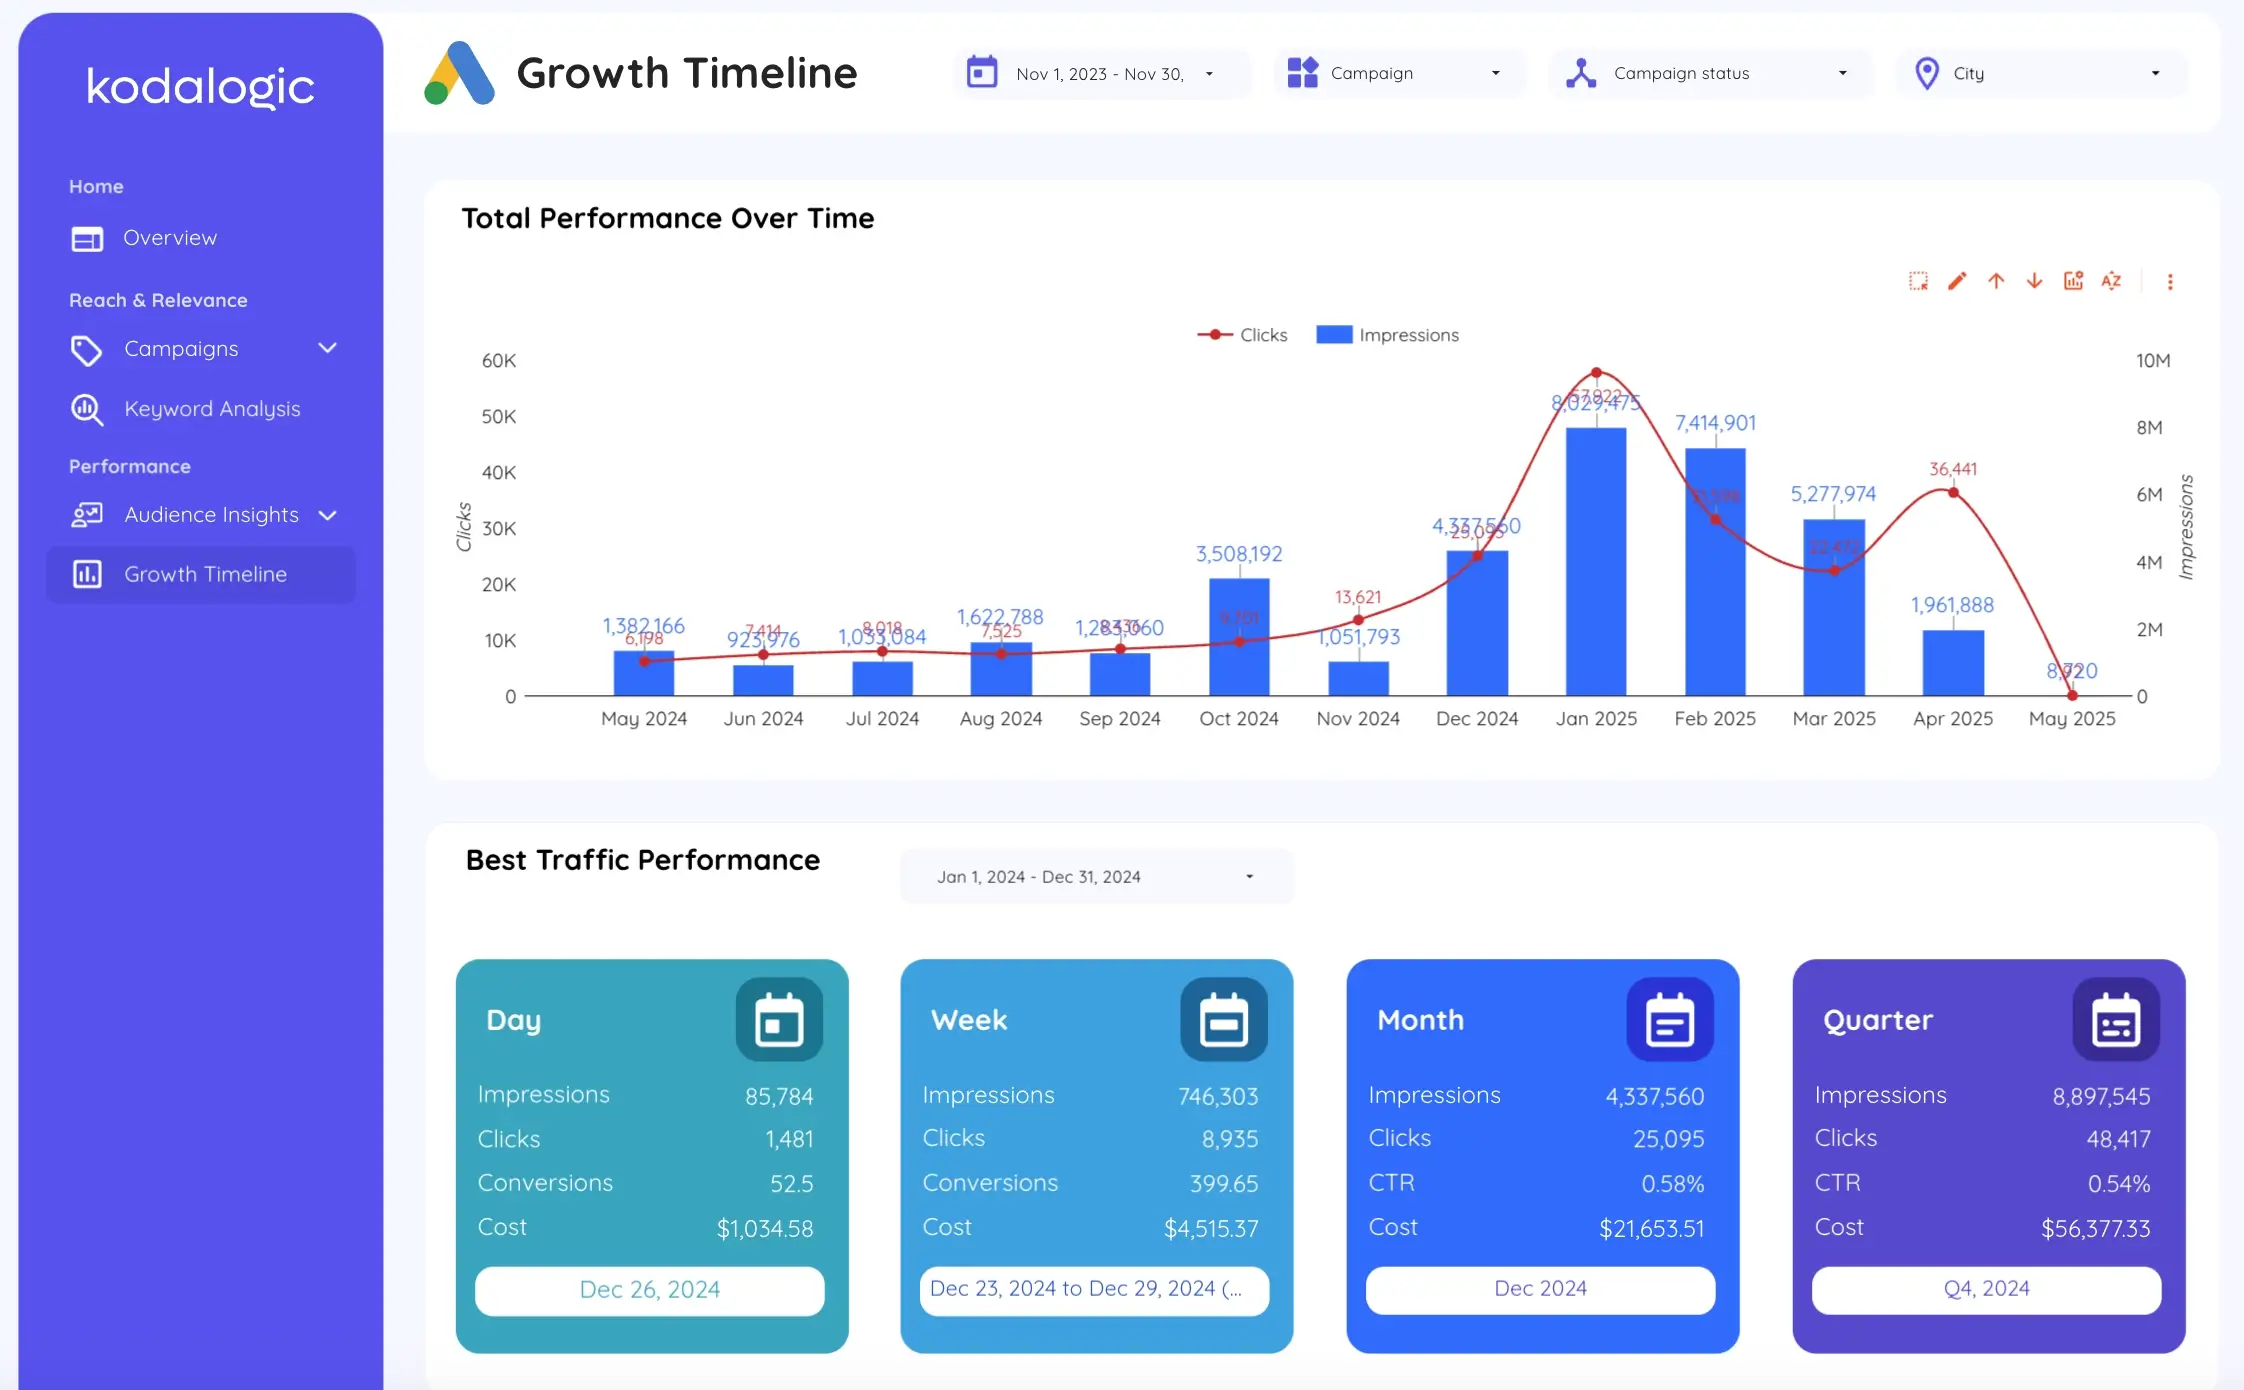
Time period comparisons show momentum. How does this month compare to last month? This week versus the same week last year? Seasonal patterns emerge. Growth trajectories become visible. You spot whether optimization efforts are actually working or whether market conditions are simply shifting.
Why Looker Studio Has Become Essential for Google Ads Teams
Looker Studio connects directly to your Google Ads account and pulls live data automatically. No more exporting. No more manual updates. The dashboard reflects current performance.
Before Looker Studio dashboards became common, teams faced these limitations. Building custom reports took days. Updating them took hours. Sharing required complicated access management. Clients got printed PDFs that became outdated immediately.
Modern Looker Studio dashboards eliminate these friction points entirely. Branded search ads deliver a 1299% ROAS with a cost per influenced contact of €65, while non branded ads achieve 78% ROAS with a cost per influenced contact of €253, demonstrating the importance of tracking keyword type performance separately.
The advantages stack up quickly. Real time data means your reports stay current without ongoing effort. Interactive dashboards let stakeholders explore different date ranges and filters without asking for new versions. Automated scheduling delivers reports without human intervention. Mobile responsive design means insights work on any device.
This efficiency compounds. If your team spends 15 hours monthly building reports manually, Looker Studio saves those 15 hours every single month. That's 180 hours annually. Multiply by team size and the cumulative time savings become staggering. More importantly, your team can redirect that time toward strategy and optimization instead of report building.
The kodalogic Google Ads Template Advantage
Building your own Google Ads dashboard from scratch means deciding which metrics matter most, designing effective visualizations, and configuring all the connections properly. This takes experience most teams don't have.
Pre-built templates eliminate this learning curve. You get a proven framework built by people who've created dozens of Google Ads dashboards. The structure follows how professionals actually analyze data. The metrics selected are ones that inform decisions. The visualizations make patterns obvious.
With kodalogic's Google Ads dashboard template, you get instant access to multi account reporting that would otherwise require custom development. Campaign performance analysis is already structured. Keyword breakdowns already calculated. Geographic insights already segmented. You connect your data and you're analyzing within minutes rather than days.
What distinguishes an excellent template from a mediocre one comes down to thoughtful design. A good template anticipates questions you'll ask. It organizes information so answers are obvious. It includes filters that let you drill down without breaking functionality.
The kodalogic template handles this elegantly. You can segment by campaign, date range, or specific dimensions. Switching between multi account view and individual account analysis takes one click. Creating custom date comparisons requires no configuration. This usability transforms how quickly your team can extract insights.
Campaign Performance Metrics That Actually Drive Results
Not all metrics deserve equal attention. Some metrics look impressive but don't predict business outcomes. Others quietly reveal whether your strategy works.
Clicks look exciting but don't indicate profitability. You could drive 10,000 clicks and still lose money if they don't convert. Focus instead on metrics that connect clicks to revenue.
Conversion rate tells you whether your targeting and messaging align. The 2024 overall average conversion rate across industries is 6.96%, which is only slightly lower than the 7.04% from the prior year. If your conversion rate lags significantly behind industry average, either your targeting is too broad or your landing page doesn't match user expectations.
Cost per conversion reveals your true customer acquisition cost. Not cost per click. Not cost per thousand impressions. Cost per actual customer. This number drives profitability. If you're spending $50 to acquire a customer who generates $200 lifetime value, you're profitable. If the reverse is true, you need optimization or different channels.
Return on ad spend (ROAS) directly translates spending into revenue. The average ROI for Google Ads in 2024 is around 200%, meaning businesses see $2 in revenue for every $1 spent on ads, though this varies significantly by industry. This is the metric that matters most to business leaders. ROAS of 3.0 means every advertising dollar generated $3 in revenue. ROAS of 0.8 means you're losing money.
Quality score predicts whether your ads will show up and at what cost. Better quality scores mean lower costs for the same ad position. This score reflects landing page relevance, expected click through rate, and ad relevance. Improving quality score directly improves profitability.
Tracking these metrics across campaigns and over time reveals optimization opportunities. Which campaigns have the best ROAS? Increase their budget. Which ones lag behind? Investigate why. Which keywords drive conversions? Add more volume. Which ones don't? Pause them.
How Multi Account Dashboards Transform Agencies
Agency life changes fundamentally when you can see all client accounts simultaneously.
Spot best practices instantly. If one client's fitness campaign is outperforming others, you quickly see why. Maybe it's bidding strategy. Maybe creative approach. Maybe audience targeting. Regardless, you can replicate that success across other fitness clients.
Identify troubling trends early. If conversion rates decline across multiple accounts simultaneously, market conditions might be shifting. You understand this faster with unified visibility. You adjust strategy proactively rather than reactively after one client notices problems.
Demonstrate value through benchmarking. Show Client A how their ROAS compares to Client B (without revealing other clients' data, of course). Explain that their performance ranks in the top quartile of your accounts. These conversations build trust and justify fee increases.
Time management improves dramatically. Instead of spending Tuesday updating individual client dashboards, you update one master dashboard. That change immediately reflects across all connected accounts. Monthly reporting that used to take 40 hours now takes four.
Scale becomes achievable. Growing from five clients to twenty clients doesn't proportionally increase reporting workload when you're using automated dashboards. You're no longer constrained by manual processes.
Setting Up Your First Google Ads Dashboard
The setup process differs from building dashboards from scratch, which typically requires significant technical knowledge and weeks of iteration.
With kodalogic's template, the process is straightforward. You purchase the template and receive a link. Click it to connect to your Looker Studio account. Grant permission for the template to access your Google Ads data. Select which Google Ads account to connect. Done.
The template automatically configures all the calculations and visualizations. Your data populates instantly. Within minutes you're looking at a professional dashboard that would have taken your team days to build.
From that point, customization is optional. The template works immediately. You can adjust colors to match your branding, modify date ranges, or add custom segments if specific metrics matter for your use case. But all of that is optional. The dashboard delivers value from day one.
Compare this to building a custom dashboard. You'd need to learn Looker Studio's data connection process, understand Google Ads dimensions and metrics, design your own visualizations, and test everything. The learning curve alone takes weeks. Most teams never finish because the complexity exceeds their bandwidth.
Keywords to Track for Campaign Optimization
Focusing on keyword performance separates good Google Ads management from excellent management.
Top performing keywords deserve increased investment. If certain keywords consistently drive conversions at lower costs, increase their bids. Expand match types slightly to capture similar searches. These are your profit centers.
Broad keywords generating clicks without conversions need investigation. Maybe landing page relevance needs improvement. Maybe bid strategy needs adjustment. Sometimes you simply pause them and focus budget elsewhere.
Quality score matters for each keyword. Low quality scores mean higher costs. Use the dashboard to identify keywords dragging down your quality score. Either improve their relevance or remove them.
Seasonal keyword trends emerge from dashboards showing performance over time. Keywords performing well in winter might not perform in summer. Adjusting bid strategy for seasonal demand improves overall ROAS.
Real World Google Ads Performance Patterns
Understanding how different industries typically perform helps set realistic expectations.
E-commerce businesses typically target ROAS of 4:1 or higher meaning $4 earned for every $1 spent, while retail generally aims for 3:1, B2B companies succeed with lower 2:1 returns due to longer sales cycles, and services businesses often require 6:1 or higher due to better profit margins.
These benchmarks provide context for your performance. If your e-commerce client achieves 3.5:1 ROAS, that's solid performance but room exists for improvement. If a B2B client achieves 2.5:1 ROAS, that's outperforming expectations.
Understanding competitive dynamics within industries also shapes strategy. During the holiday season specifically, fashion accessories saw increased competition with CPM rising 24.66% and CPC rising 22.22% month over month as more advertisers increased spending.
Future Proofing Your Google Ads Reporting
Digital advertising evolves continuously. Tools change. Platforms update. Reporting needs shift.
Building reporting around solid metrics rather than specific tool features future proofs your approach. ROAS will always matter. Conversion rates will always matter. Cost per acquisition will always matter. These fundamentals don't change even when Google Ads adds new features.
Dashboards built on these core metrics remain valuable even as Google adds AI powered features or changes the interface. You're measuring what matters, not what's trendy.
Stay current with Google's changes. Google continuously updates how attribution works and how campaigns are structured. Using dashboard templates maintained by professionals ensures your reporting reflects current best practices. You're not trying to retrofit old dashboards into new systems.
Agency Life After Automating Google Ads Reporting
The difference between manual reporting and automated reporting compounds over time.
Instead of Monday mornings spent building reports, Monday mornings become strategy sessions. You're analyzing optimization opportunities rather than formatting numbers. Tuesday isn't spent calculating metrics. Tuesday is spent testing new campaigns or refining targeting. By Friday, you've implemented improvements that directly impact client results.
Your team finds more satisfaction in their work. They're solving problems rather than repeating manual tasks. They're thinking strategically rather than administratively. Retention improves because people prefer roles with intellectual challenge.
Clients see performance more frequently. Instead of monthly reports, dashboards provide real time visibility. Clients gain confidence in your management. They understand what's working and why. They feel more informed about how you're deploying their budget.
This cycle creates a feedback loop where automation drives better results, better results build trust, and trust leads to larger budgets and more client engagement.
Getting Started Today
The gap between wanting streamlined Google Ads reporting and having it has never been smaller.
You don't need a development team. You don't need weeks of learning complex tools. You don't need expensive custom solutions or complicated integrations.
Purchase kodalogic's Google Ads dashboard template. Click through their setup page. Connect your Google Ads account. Your dashboard populates automatically with your actual performance data.
Within minutes, you're looking at professional reporting that previously would have required significant time investment. Within the time it takes to grab a coffee, your team has access to insights that used to take days to compile manually.
That time savings is genuine. That efficiency is real. That strategic clarity is immediately actionable.
The only question is whether you'll implement this today or continue with the manual approach for the next reporting cycle.
Get the kodalogic Google Ads dashboard template now. Stop building reports manually and start optimizing campaigns based on real time data.