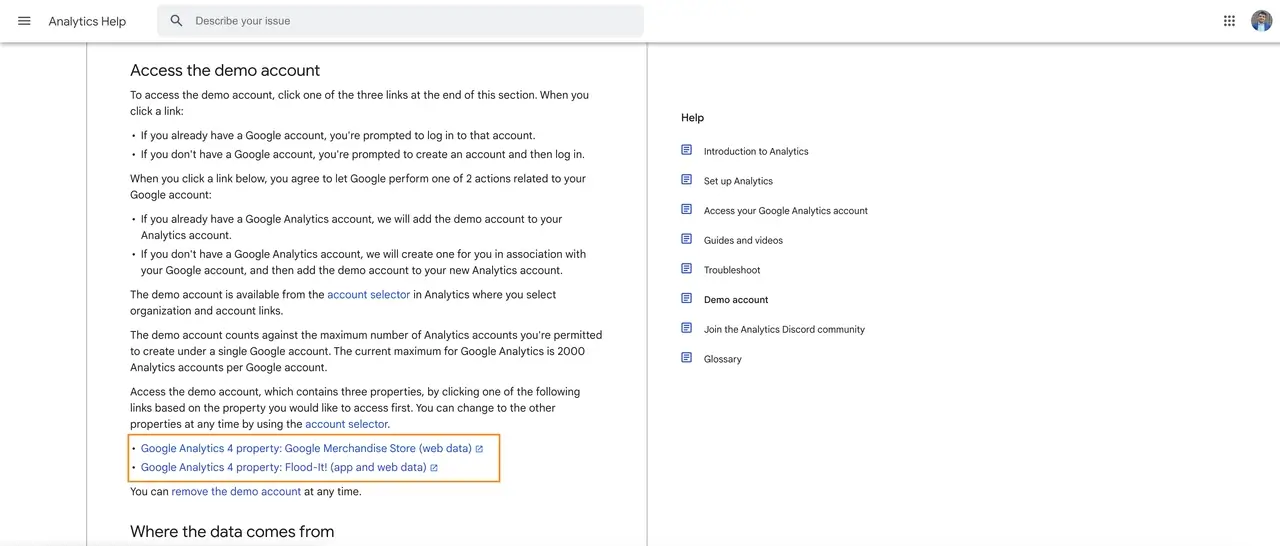
Google's help page opens by saying the demo account "contains 2 Google Analytics properties". Further down it tells you to "click one of the three links", then says the account "contains three properties", and then lists two. There are two. Here they are, and everything below was checked against Google's documentation on 8 September 2026.
→ Open the Google Merchandise Store property (web data, an online store)
→ Open the second property, Flood-It! (app and web data, a mobile game)
Click either one while signed into a Google account. There is no form, no approval and no password. If you searched for the address itself, it is https://analytics.google.com/analytics/web/demoaccount, and it works, but it drops you in the account selector without opening a property.
Key takeaways
- There are two demo properties, not one: Google Merchandise Store (
213025502, web ecommerce) and Flood-It! (153293282, an app and web property carrying games reporting). Both links are above. - There is no demo account login. Access attaches to whatever Google account you are already signed into. If the account does not appear afterwards, you were signed into a different one when you clicked.
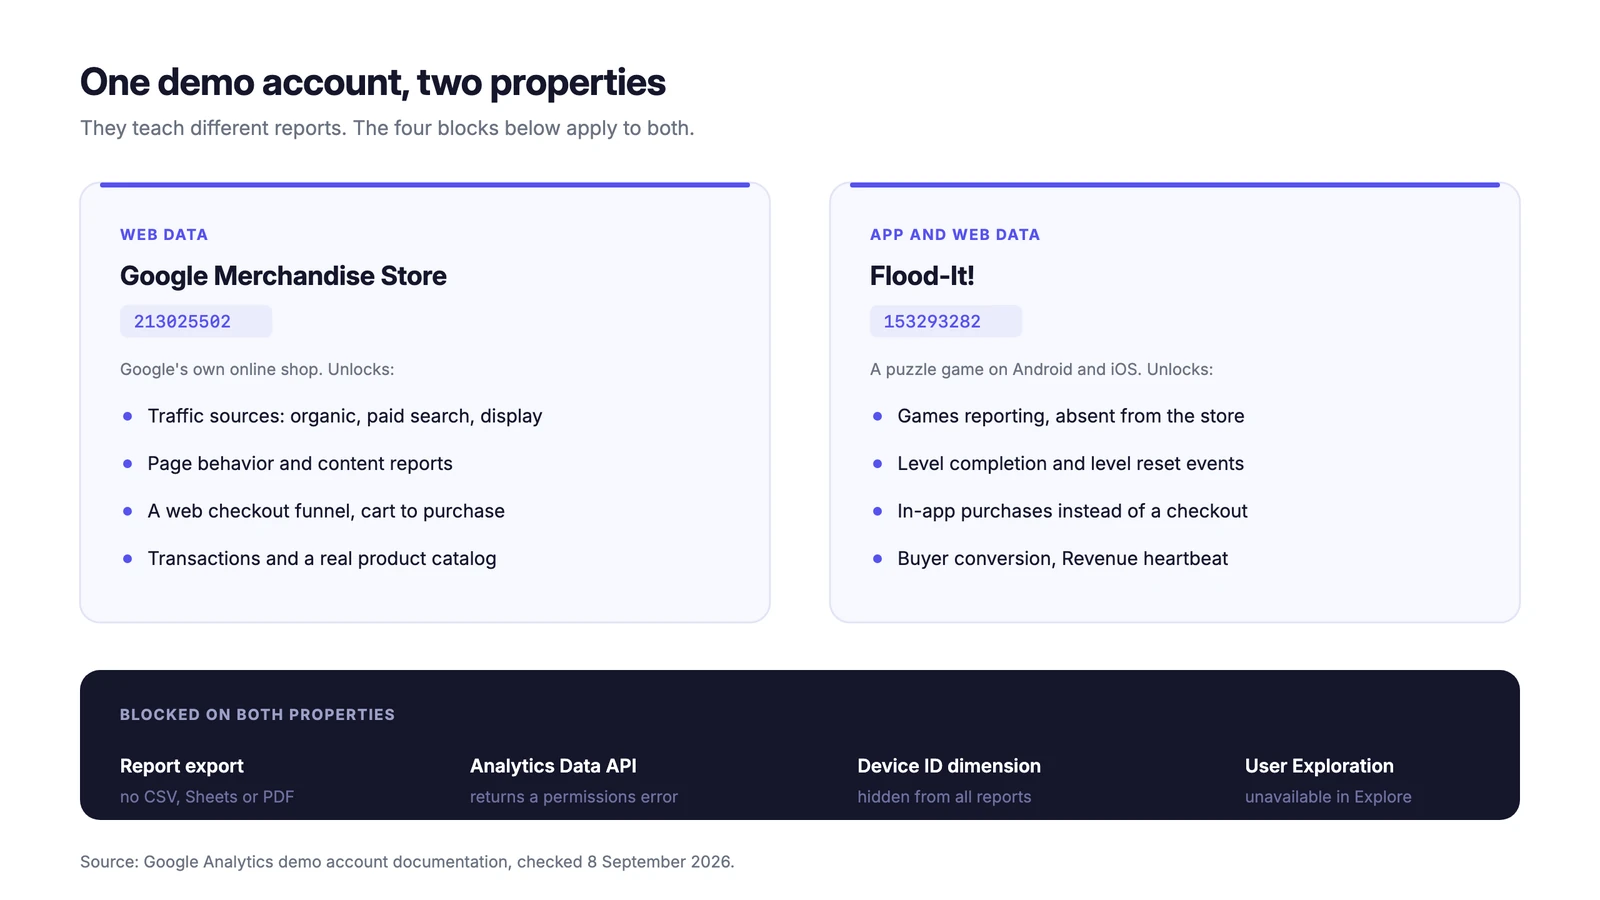
- Google removes four capabilities from the demo properties: report and exploration export, the Analytics Data API, the device ID dimension, and the User Exploration technique.
- In Looker Studio the names change. Google's documentation calls the first property Google Merchandise Store; the Looker Studio picker calls it GA4 - Google Merch Shop. Match on the property ID, not the name.
- If you need to export or query the data, the same store is published separately as a BigQuery public dataset, frozen at 92 days from 2020 and 2021.
The two GA4 demo properties, and how they differ
The demo account is a live GA4 account that Google opens to anyone with a Google account. It holds two properties that teach different reports.
Both are documented on Google's demo account page, which is where the links above and the property IDs below come from. It is also where the count goes wrong. The screenshot shows it: the sentence says the account "contains three properties" and the box directly beneath it holds two links.
The Google Merchandise Store demo account
This is the property almost everyone means by "the demo account", and the one behind the first link above. It is Google's own shop selling Google-branded merchandise. Google describes its data in three parts: traffic source data (organic, paid search and display), content data (which URLs users look at and how they interact with the page). Transaction data from the store itself.
Its property ID is 213025502. That number is the reliable way to identify it, because the display name changes between Google's documentation and Looker Studio.
Flood-It!, for apps and games
The second property is the one guides rarely cover. It is the part of the demo account that teaches GA4's games reporting.
Flood-It! Is a strategy puzzle game, published on Android and iOS, in which you flood a board with a single color inside a fixed number of steps. Google documents its property as carrying:
- Games reporting, which the Merchandise Store property does not have.
- Calculated metrics, including average revenue per active user, average engagement time, and two built on Google Play's recommended KPIs: Buyer conversion and Revenue heartbeat.
- Events data for in-game actions, specifically level completion and level resets.
- Ecommerce data covering in-app purchases rather than a checkout.
Google documents what each property contains and not what it lacks. The following is our reading rather than a quote: if you are learning GA4 for an app or a game, the level events and in-app purchases live only in this property. The product catalog and web checkout live only in the store.
One correction before you start. Guides that still list a Universal Analytics demo property are out of date: Universal Analytics stopped processing data in 2023. Google's page now links two GA4 properties and nothing else.
Signing in, and why there is no demo account password
There is no separate username or password for the demo account.
Access attaches to your own Google identity. Google's page describes the two cases: if you already have a Google Analytics account, the demo account is added to it. If you do not, Google creates an Analytics account for you in association with your Google account and adds the demo account to that. Either way you end up signed in as yourself, holding a Viewer role on somebody else's property.
That has one consequence before you file a support ticket. If you are signed into several Google accounts in the same browser, the demo account attaches to the one that was active when you clicked. It will not show up under any of the others. Switch account and click the link again.
The four capabilities Google removes
Every user of the demo account gets the Viewer role, and Google strips four specific capabilities out of it.
You cannot export a report or an exploration out of the demo account: no CSV, no Google Sheets, no PDF of an exploration. If the plan was to pull demo data into a spreadsheet and work on it there, this is the wrong tool and no setting turns it back on. You also cannot reach either property through the Analytics Data API, so scripts, connectors and custom charts built on that API return a permissions error, and re-authenticating does not help. The remaining two are the device ID dimension, which is hidden. The User Exploration technique, which is unavailable. Between them they close off following a single user across sessions.
Google states all four on its demo account page:
The Google Analytics properties do not include report or exploration export functionality, the ability to see the device ID dimension, or the use of the User Exploration technique in the Explorations main menu.
You cannot use the demo account with the Analytics Data API for either property type. Attempts to do so result in a permissions error.
Separately from those four, the Viewer role means you can create personal assets and see shared ones. In Google's words you "cannot collaborate on shared assets". Standard reports, Explore with its other techniques, comparisons, segments, custom date ranges and the Looker Studio connection all work normally. If the Looker Studio connection throws an error rather than a permissions message, that is a different problem and we cover it in Data Studio cannot connect to your data set.
Five things worth opening on the first visit
Google suggests four starting points on its own page. We have added a fifth that uses both properties at once.
- Which channel acquires the most new users across the different platforms.
- How many total unique users each of the two businesses has.
- How many conversions happened on the Flood-It! app and the Merchandise Store website in the last week.
- Where users enter the conversion funnel, and where they drop out. This is a funnel exploration, and the section below shows what it returns.
- How a web checkout compares against in-app purchases. The store property carries the first and the Flood-It! property carries the second, so this is the one comparison you cannot make inside a single property.
What one month of the Merchandise Store looks like
The store runs a full ecommerce setup, so the funnel it produces has every step a real one has.

The same figures, to read against your own screen:
| Event | Count | Share of page views |
|---|---|---|
page_view | 418,164 | 100% |
session_start | 122,811 | 29.37% |
view_item | 92,975 | 22.23% |
user_engagement | 80,416 | 19.23% |
scroll | 66,592 | 15.92% |
add_to_cart | 15,067 | 3.60% |
purchase | 1,389 | 0.33% |
Source: Google Merchandise Store demo property (213025502), 1 to 31 October 2024, read through the Kodalogic GA4 template in Looker Studio.
The instructive row is add_to_cart to purchase: 90.8% of carts did not become an order that month. That is a drop-off you can take apart with the tools in front of you. This is the point of practicing here rather than on invented data.
Two cautions on reading the rest of the table. The percentages are shares of page views, not of sessions. They are not comparable to the session-based conversion rates quoted in ecommerce benchmarks.
And this is one month of one store. A store whose traffic includes a lot of people who came to look at a famous demo dataset rather than to buy a hoodie. Reproduce it, do not benchmark against it.
The product names are real, which matters the first time you build a product-performance table and want to check it groups correctly. Google's obfuscation applies to user-level data, not to the catalog.
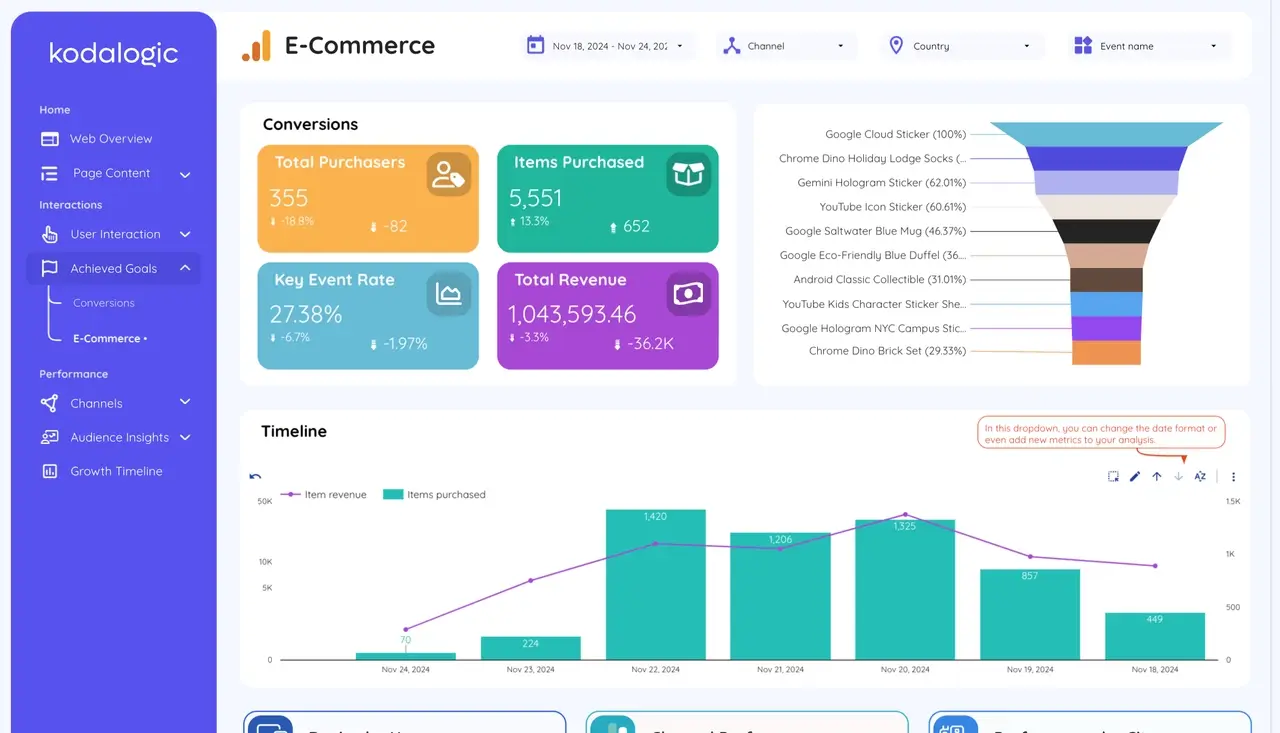
Because the property is live, your numbers will differ. Set the same date range to reproduce these.
Demo account or BigQuery sample: which one you need
Google publishes the Merchandise Store data twice, and the two copies answer different questions.
| Demo account | BigQuery sample | |
|---|---|---|
| Where it lives | GA4 interface | BigQuery public dataset |
| Date range | Live | 1 Nov 2020 to 31 Jan 2021 |
| Export a report | No | Yes, in SQL |
| Analytics Data API | Blocked | Not applicable |
| Raw event rows | No | Yes, one per event |
| Looker Studio | Yes | Yes, via BigQuery |
| Cost | Free | Free in sandbox tier |
The BigQuery public sample is queried at bigquery-public-data.ga4_obfuscated_sample_ecommerce.events_*. The events_* wildcard at the end matters: without it the query fails, because the data is split into one table per day. It is raw event-level export, one row per event, and Looker Studio reads it through the BigQuery connector. Google documents it as three months of obfuscated data, 2020-11-01 to 2021-01-31, carrying placeholder values such as <Other>.
Use the demo account to work inside a live GA4 interface or to feed a Looker Studio report. Use the BigQuery sample for SQL practice, for learning the GA4 event schema, and for anything you need to export. Its date range makes it useless for any question about how people behave now.
Connecting the demo account to Looker Studio
The Looker Studio connection works, and the block on the Analytics Data API does not affect it.
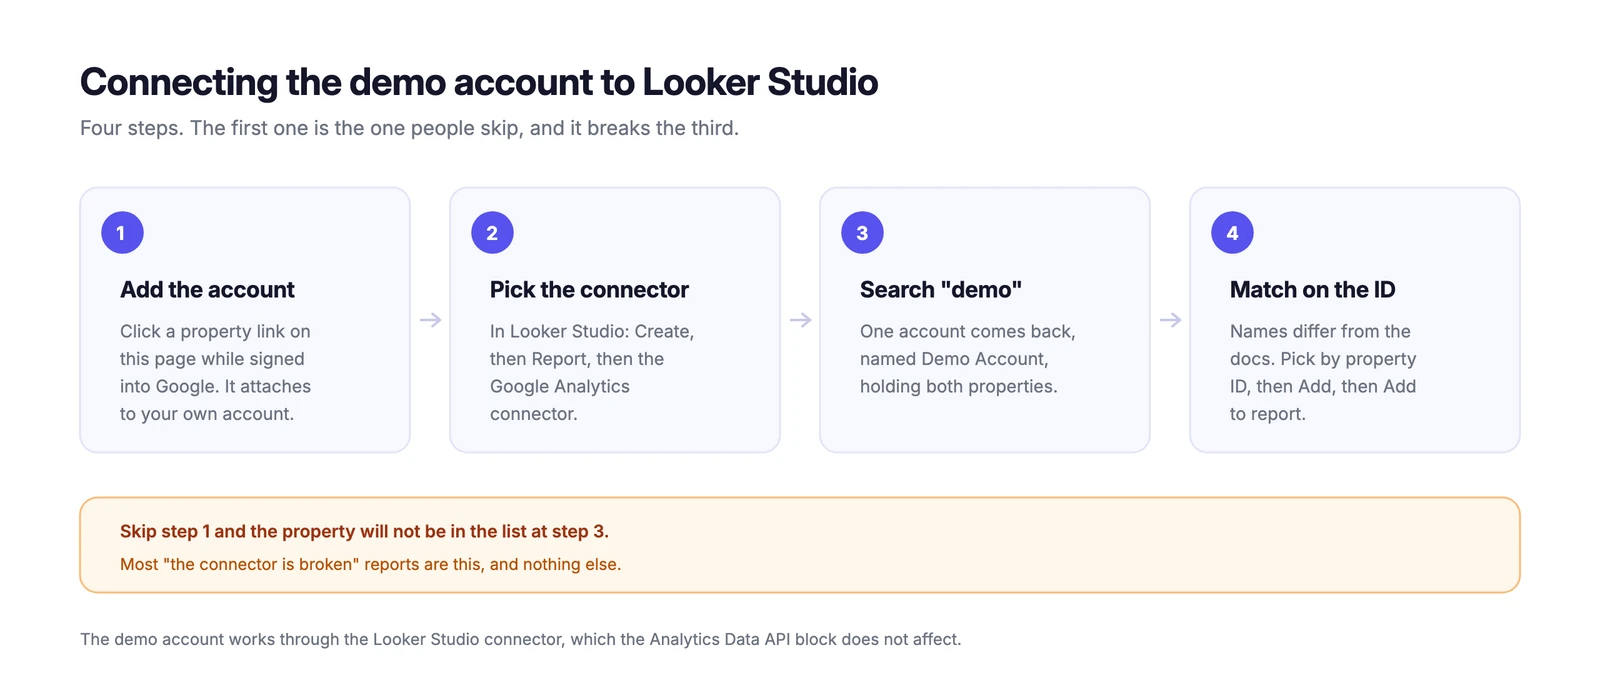
Step 1. Add the demo account to your own Google account. Use one of the two property links above. This is the step people skip. Skipping it is what produces the "the connector is broken" message: the demo account has to be attached to your Google identity before Looker Studio can see it, because Looker Studio lists the Analytics accounts you have access to. Nothing in the Looker Studio interface tells you this.
You know it worked when Analytics opens on the demo account's Home screen, with live numbers in it rather than an empty property.
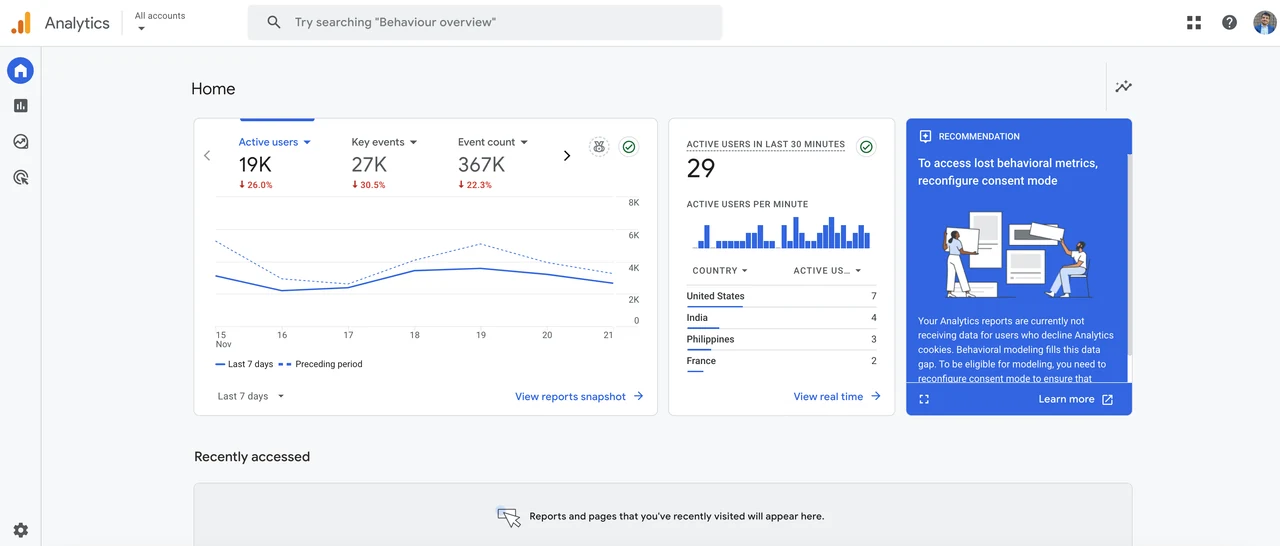
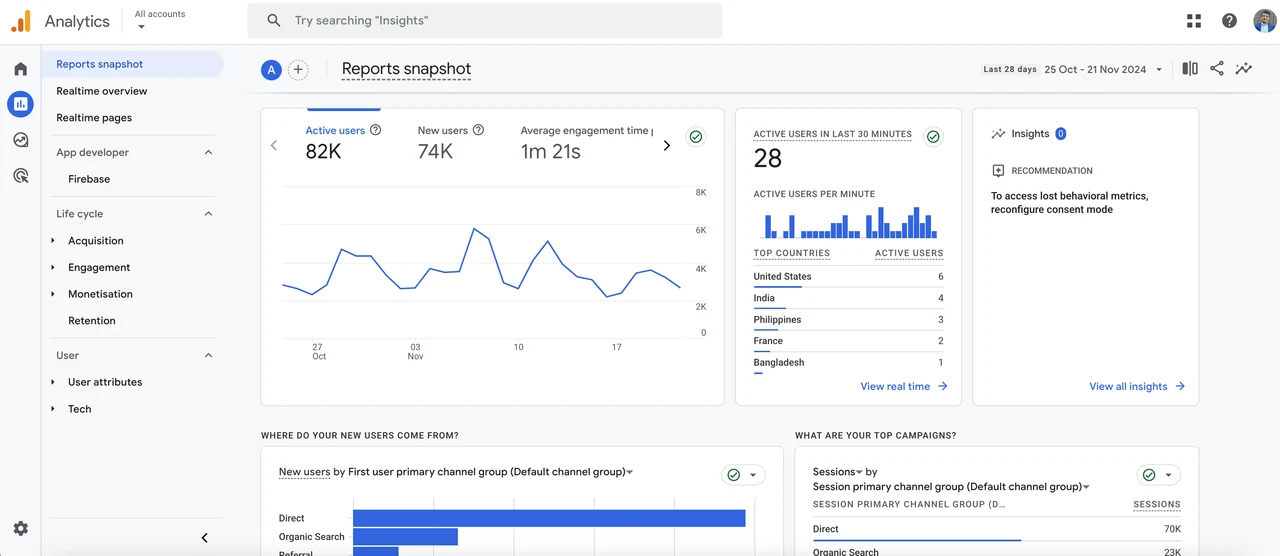
From here every standard GA4 report is available. The Reports snapshot is the quickest way to confirm you are looking at real traffic rather than a sample.
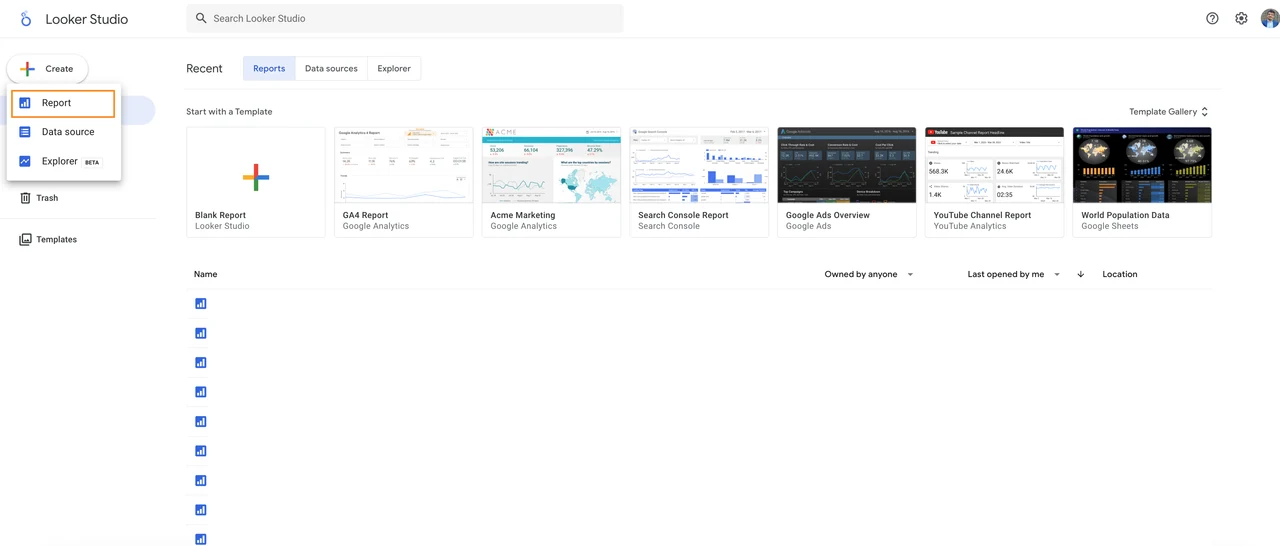
Step 2. Open Looker Studio and pick the Google Analytics connector. Go to Looker Studio, click Create, then Report. The Create button is top left, and Report is the first of its three options.
The connector gallery opens on its own. You want the one called Google Analytics, which is Google's own connector for GA4 properties, not Looker (a different, paid product) and not BigQuery (that one is for the raw export covered further down).
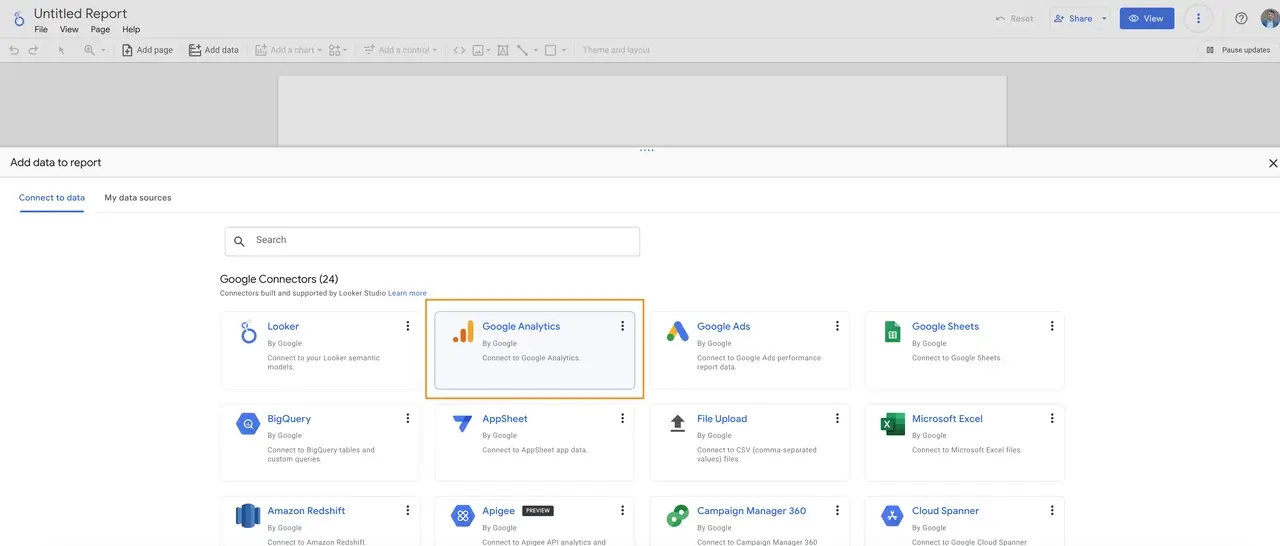
Step 3. Filter the account list by typing demo. The connector shows three columns: account, property, and view. Typing demo in the first column leaves one result, an account literally named Demo Account.
Selecting it fills the second column with both properties at once. This is the screen where you can confirm you actually completed step 1: if Demo Account does not appear here, you are not in the demo account yet. No amount of reloading will change that.
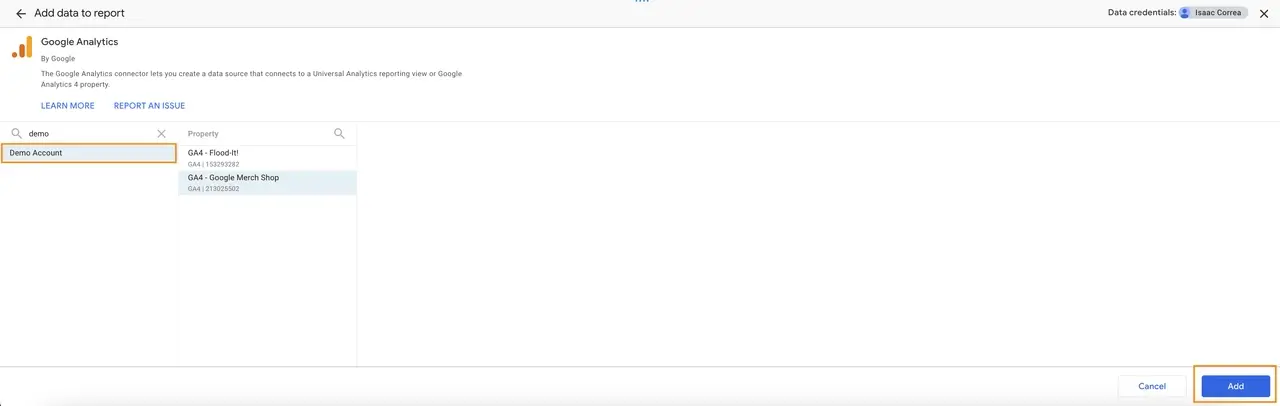
Step 4. Select the property by its ID, then click Add, then Add to report. Looker Studio will warn you that you are about to add data to the report. That warning is routine and it is not about the demo account. Once you accept, the report opens with a default chart already bound to the property. Every GA4 dimension and metric is available in the panel on the right.
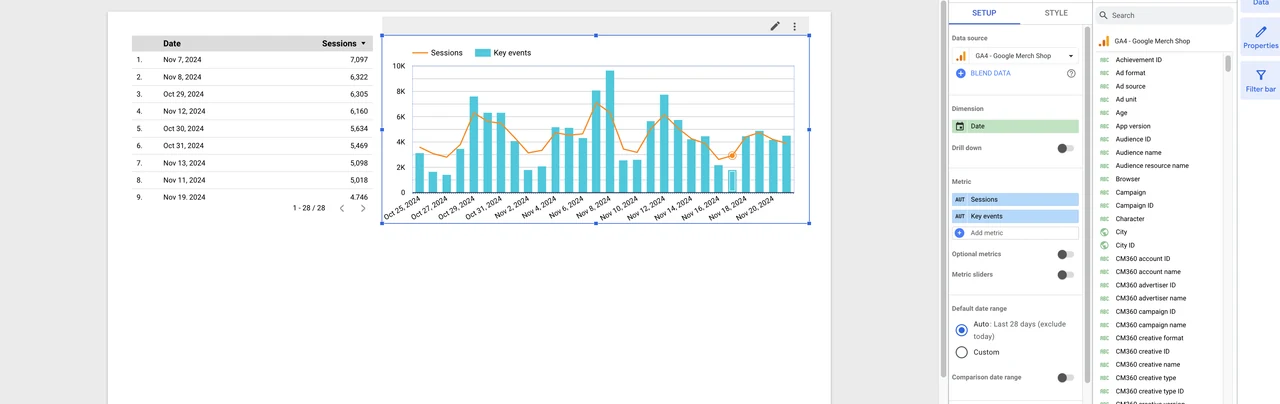
Note the data source name in that Setup panel: GA4 - Google Merch Shop. That is the same property Google's documentation calls Google Merchandise Store, and it is the second place the mismatch shows up.
Step 3 is where the names stop matching. The properties do not carry the same names in Looker Studio that they carry in Google's documentation. Google's help page calls the first one Google Merchandise Store. The Looker Studio picker, in our screenshot above, calls it GA4 - Google Merch Shop. Same property, different label, and anyone scanning that list for the word "Merchandise" will not find it.
Match on the property ID printed under each name instead: 213025502 is the store, 153293282 is Flood-It!.
There is a practical reason to build the habit and not just apply it here. A property's display name is a label its owner can edit at any time. This the numeric ID is assigned once and never changes. Any instruction that tells you to look for a property by name, including ours, is one rename away from being wrong. The ID is the part of these instructions that cannot go stale.
Once connected, the report behaves like any other GA4 report. If GA4's split between dimensions and metrics is new to you, dimensions vs metrics in Data Studio is the next thing to read. Data Studio templates that automate GA4 reports covers scheduling.
What this guide does not cover
Two boundaries, so you know what you are holding.
Property IDs are stable, display names are not. The IDs come from Google's documentation. The names in the Looker Studio picker come from our screenshot of it, and a display name can change without warning. Match on the ID.
The October funnel is one month, not a benchmark. It is a single month of a live property read through one template, so it cannot tell you whether 0.33% is seasonal, and your numbers will move. It is there to be reproduced.
Frequently asked questions
What is the Google Analytics demo account login? There is no demo account login. You sign in with your own Google account, and clicking either property link attaches the demo account to it. If the account does not appear afterwards, you are signed into a different Google account than the one you clicked with.
How many properties does the Google Analytics demo account have? Two: Google Merchandise Store (213025502) and Flood-It! (153293282). Google's own help page is inconsistent about this. Its opening line says the account "contains 2 Google Analytics properties" and two later passages say three, but only two are linked.
What is the Google Merchandise Store demo account? It is the first of the two demo properties, ID 213025502, holding web ecommerce data from Google's own online shop: traffic sources, page behavior and transactions. When an article says "the Google Analytics demo account" without qualifying it, this is almost always the property it means.
Is the GA4 demo account the same as the Google Analytics demo account? Yes. Both demo properties are GA4 properties. The Universal Analytics demo property is gone, so there is no longer a non-GA4 version to distinguish it from.
Is there a Google demo account for Ads, Search Console or Tag Manager? No. Google publishes this public demo account for Analytics only. There is no equivalent open demo property for Google Ads, Search Console, Tag Manager or Merchant Center. If that is what you are looking for, this page will not have it.
Is the Google Analytics demo account free? Yes, with no trial period and no card. Google notes that it counts against the maximum number of Analytics accounts allowed under a single Google account, currently 2,000.
Is the demo account data real? Yes. It comes from the Google Merchandise Store, a live shop selling Google-branded goods. From Flood-It!, a puzzle game on Android and iOS. Google states that the data "is obfuscated but is still typical Analytics data".
Can I export data from the Google Analytics demo account? No. Google removes report and exploration export from both demo properties. There is no CSV, Sheets or PDF export. For exportable data, use the BigQuery public sample described above.
Can I use the demo account with the Analytics Data API? No. Google blocks the Data API for both property types, and attempts return a permissions error.
Why can I not find Google Merchandise Store in Looker Studio? Because Looker Studio lists it under a different name. The picker shows it as GA4 - Google Merch Shop, with property ID 213025502 printed underneath. Search the list for the ID rather than for the word "Merchandise".
Which demo property has ecommerce data? Both, in different forms. The Merchandise Store carries web transactions from a checkout. Flood-It! Carries in-app purchases, plus games reporting and level events that the store property does not have.
Can I change anything in the demo account? No. Everyone holds the Viewer role. You can read every report, build your own explorations and create personal assets. You cannot change configuration, create events or add users.
How do I remove the Google Analytics demo account? In Analytics, open Admin, then Account access management, and remove yourself. You can add it back at any time with the links above.
What the demo account is for once you stop learning
Most guides treat the demo account as a place to learn GA4. For anyone who builds reports for other people, it has three uses that outlive the learning.
Testing a report before it touches a client's property. You can point a new dashboard at the demo account and confirm that every connection, calculated field and filter behaves, without the risk of leaving a broken chart in somebody's live reporting. One limit matters here and it is the export block above: you can build the report against the demo account. You cannot hand the client a PDF of it. The report has to be re-pointed at their property before anything leaves the room.
Showing what a report will look like before the account exists. A prospect who has not granted access yet cannot see their own numbers. The demo account gives them the same layout with real traffic in it. This reads very differently from a screenshot full of placeholder text.
Onboarding someone new. A person learning GA4 on the demo account holds the Viewer role. There is no configuration to break and no client data to see. The two properties cover both halves of the job: the Merchandise Store for web and ecommerce, Flood-It! For app and games reporting.
Sources
Everything factual on this page comes from one of these four, and was checked on 8 September 2026.
- Google Analytics demo account, Analytics Help. Source for both property links and IDs, the description of each property's data, the Viewer role, the four removed capabilities, the 2,000 account limit, and the quoted sentences.
- Google Analytics 4 ecommerce web implementation, Google for Developers. Source for the BigQuery public dataset, its table path, its three-month range from 2020-11-01 to 2021-01-31, and its obfuscation.
- Universal Analytics sunset, Analytics Help. Source for Universal Analytics no longer processing data.
- The October 2024 event counts in the funnel table were read by us from the Google Merchandise Store demo property (
213025502), 1 to 31 October 2024, through the Kodalogic GA4 template in Looker Studio. The 90.8% cart figure is calculated from the two rows above it. Anyone with the demo account can reproduce the table by setting the same date range.
The Kodalogic GA4 template connects to the demo account
The demo account hands you the data, and reading it still means building the report.
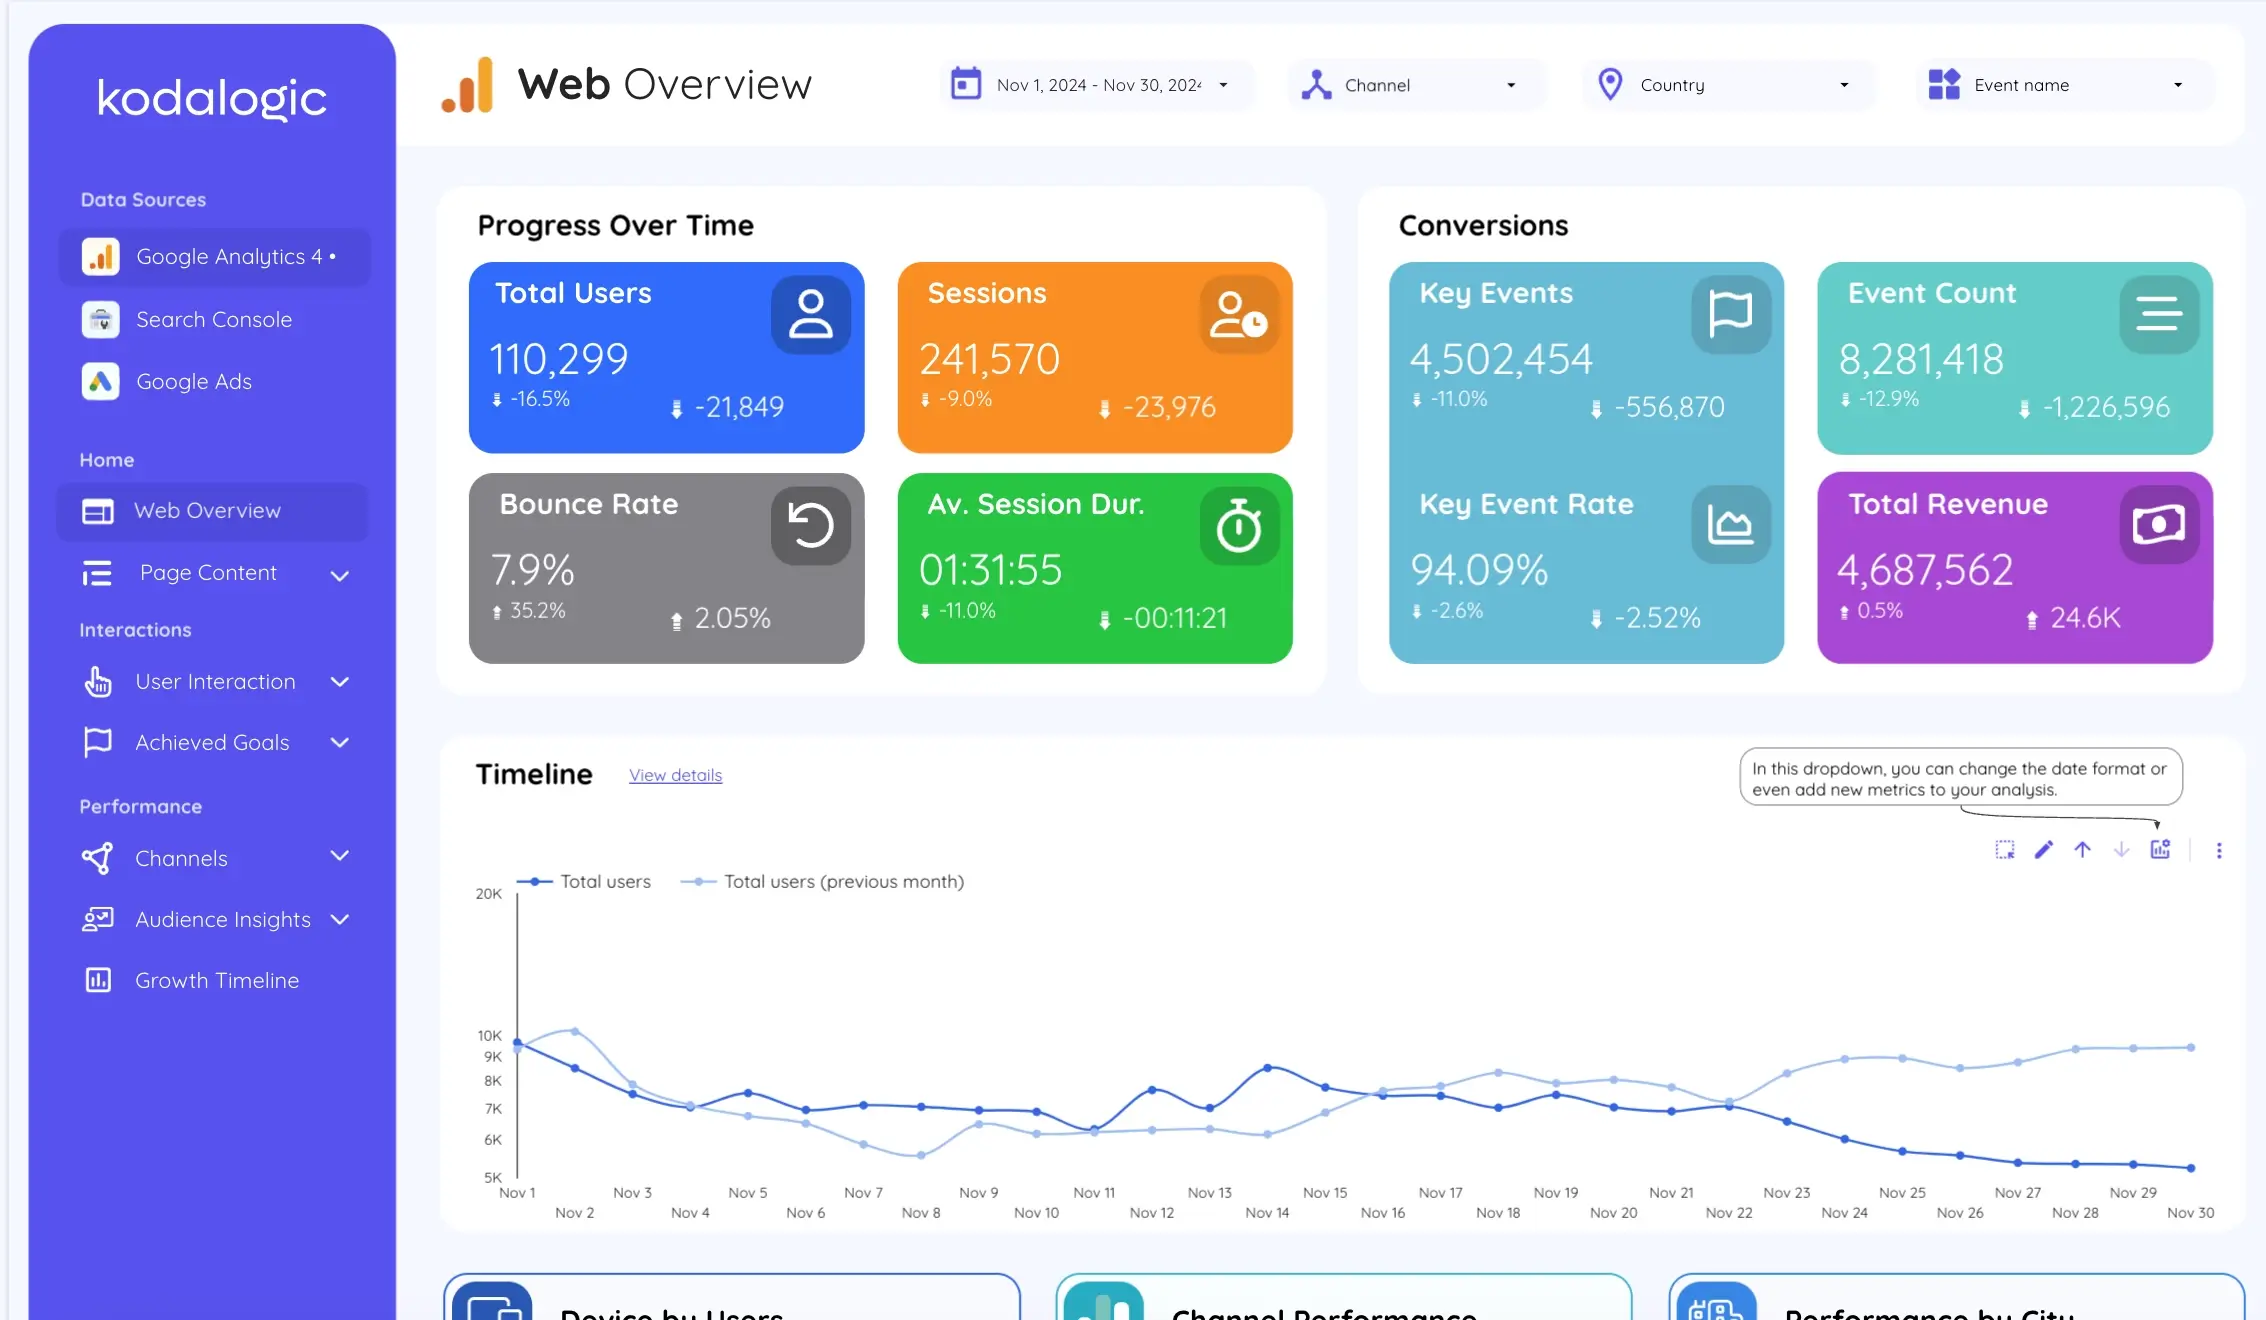
The GA4 Dashboard template connects to any GA4 property, the demo account included. Arrives with the structure already in place: web overview, page content, user interaction, ecommerce and audience. The two dashboard screenshots in this article, and the October funnel above, come from it running on the demo property.
That last part is worth using whether or not you buy anything. Connect the template to the demo account, set the date range to October 2024. Check our funnel table against what you see. If the numbers match, you have learned how the report is built. If they do not, we would rather you found out on Google's data than on yours.
You do not need a template for all of this. To answer one question, GA4's own reports are faster than any dashboard. The five starting points above are all standard reports. A template earns the setup when the same questions come back every month, across several properties. For someone who does not want to open Analytics at all. Below that, it is overhead.

Written by
Isaac CorreaHe runs the commercial side of Kodalogic and co-founded Hellomatik. Before that he built more than two hundred Looker Studio dashboards for clients, and collected 107 five-star reviews doing it.