21 of February of 2025
SEO Keyword Ranking Report: The Template That Actually Tells You What's Happening

Isaac Correa
Looker Studio Templates
SEO & Marketing Dashboards
Most keyword ranking reports show you positions. A real one shows you what those positions mean, which ones to fix first, and how branded versus generic performance are telling you different stories. Here is the format that actually works — and how to aut
A keyword ranking report that only shows positions is like a speedometer without a fuel gauge. Technically accurate. Practically useless. Here is what a real one looks like.
Why Most Keyword Ranking Reports Miss the Point
There is a specific moment every SEO professional knows. You send a report. The client looks at it. They say: "So what does this mean for us?"
That question is the failure. A keyword ranking report that needs explaining is not doing its job.
A search engine ranking report — or SEO keyword ranking report, as most teams call it internally — does more than list positions. It shows whether organic traffic is moving in the right direction and, more importantly, why. Without that context, a list of keyword positions is just noise.
The numbers in a position report are not the analysis. They are the raw material. A page ranking 7th for a commercial keyword with 3,500 monthly search volume and a 1.2% CTR is screaming one thing: the title tag is broken. A keyword moving from position 18 to position 11 over three weeks is telling you something specific: the content update you made four weeks ago is starting to work. A branded query with 4,000 impressions and a 0.3% CTR is telling you your snippet is not matching what people expect when they see your brand name.
None of that shows up in a list of keywords and positions.
This guide covers what belongs in a proper SEO keyword ranking report format, why each section is there, and how to build the whole thing in Looker Studio with your live Search Console data — automatically, without spreadsheets, without manual exports, and without the two-hour interpretation session that normally follows.
Questions a Proper Search Engine Ranking Report Should Answer
Before getting into the format, here is the test. A useful keyword ranking report should answer all of these without anyone needing to pull additional data.
Questions you can answer with this report: Are my non-branded rankings improving, or is organic traffic growth coming entirely from branded queries? Which keywords are 1-2 positions away from tripling their clicks? Which pages have high impressions but low CTR — and is it a title tag problem or a ranking problem? Is a specific content topic gaining ground week over week, or stalling despite investment? Which search intents are driving my top-performing rankings, and where are the gaps? Where are my keywords distributed across position bands — and is the distribution shifting? Which country is driving most of my organic traffic, and how does performance compare across markets?
If your current keyword ranking report does not answer these, the sections below explain what is missing and why it matters.
What Google Search Console Gives You — and What It Does Not
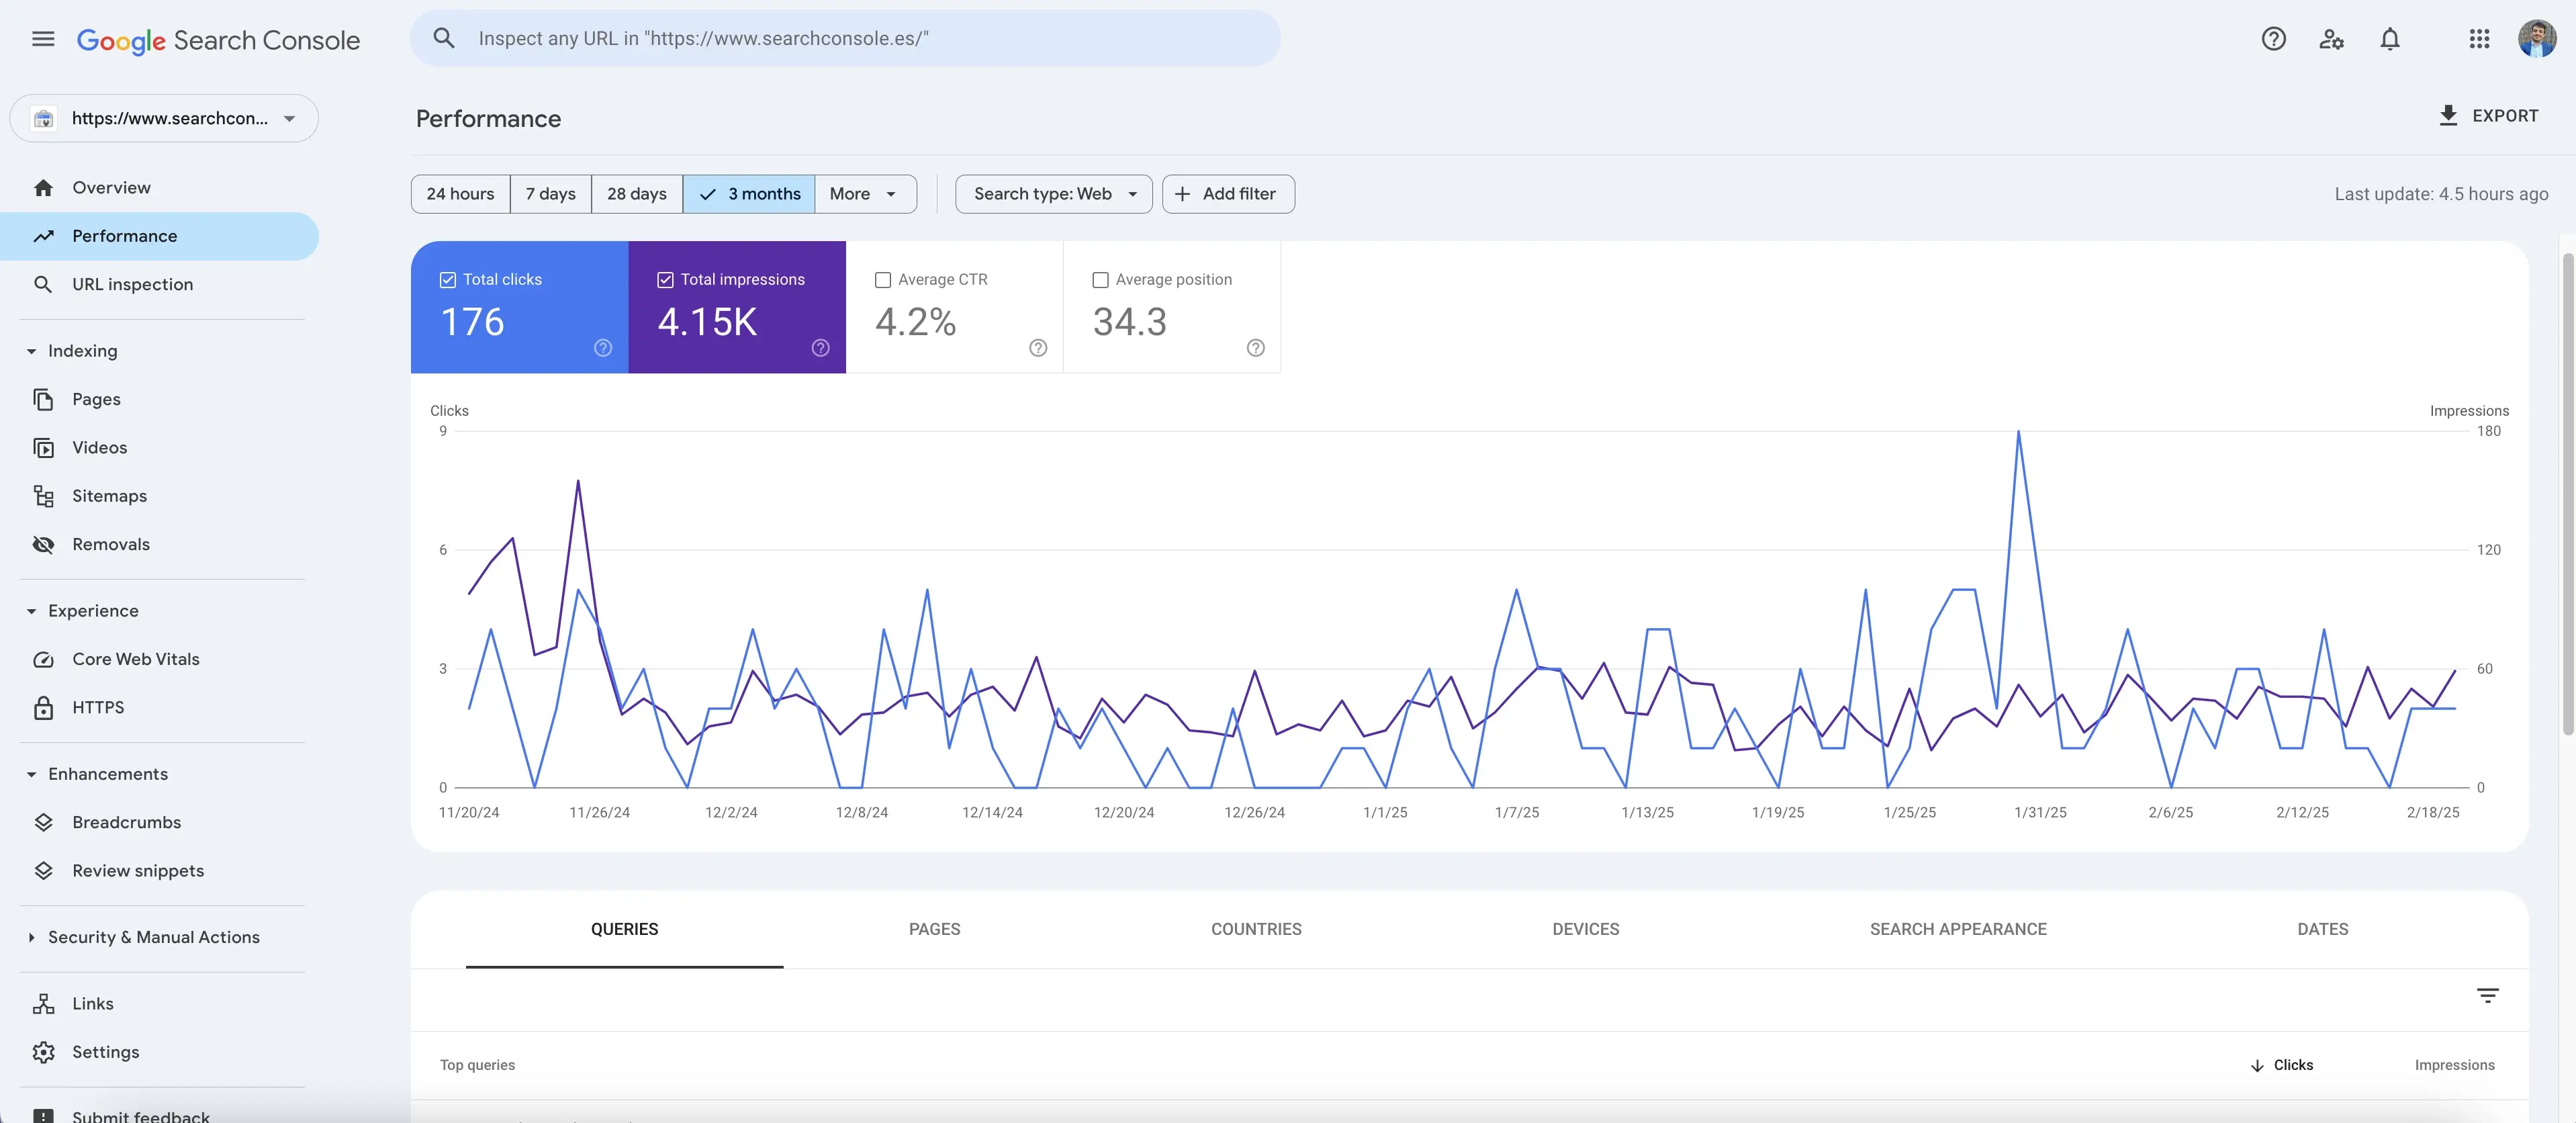
Search Console is indispensable. First-party data directly from Google, free, with 16 months of historical ranking data and figures that match exactly what Google uses to calculate positions. For understanding what is happening in organic search, nothing comes close as a primary source.
But its interface is built for data access, not analysis. That distinction matters practically.
What Search Console gives you: impressions, clicks, CTR, average position — per query and per page — filterable by date, device, country, and search type.
What it does not give you:
Any automatic separation of branded from non-branded keywords. Any search intent classification. Any keyword cluster view that groups related queries by topic. Any ranking distribution that shows how your keyword universe is spread across position bands. Any rank tracking that flags what is rising and falling in historical data. Any written analysis of what the changes mean for organic traffic.
You can build all of this manually in spreadsheets. It takes hours. The numbers are already stale by the time the work is done.
The automated keyword ranking report format below solves this. Every section connects to your live Search Console data in Looker Studio and updates automatically.
The Keyword Ranking Report Format That Works
1. Brand vs Generic Keywords: The Split That Changes Everything
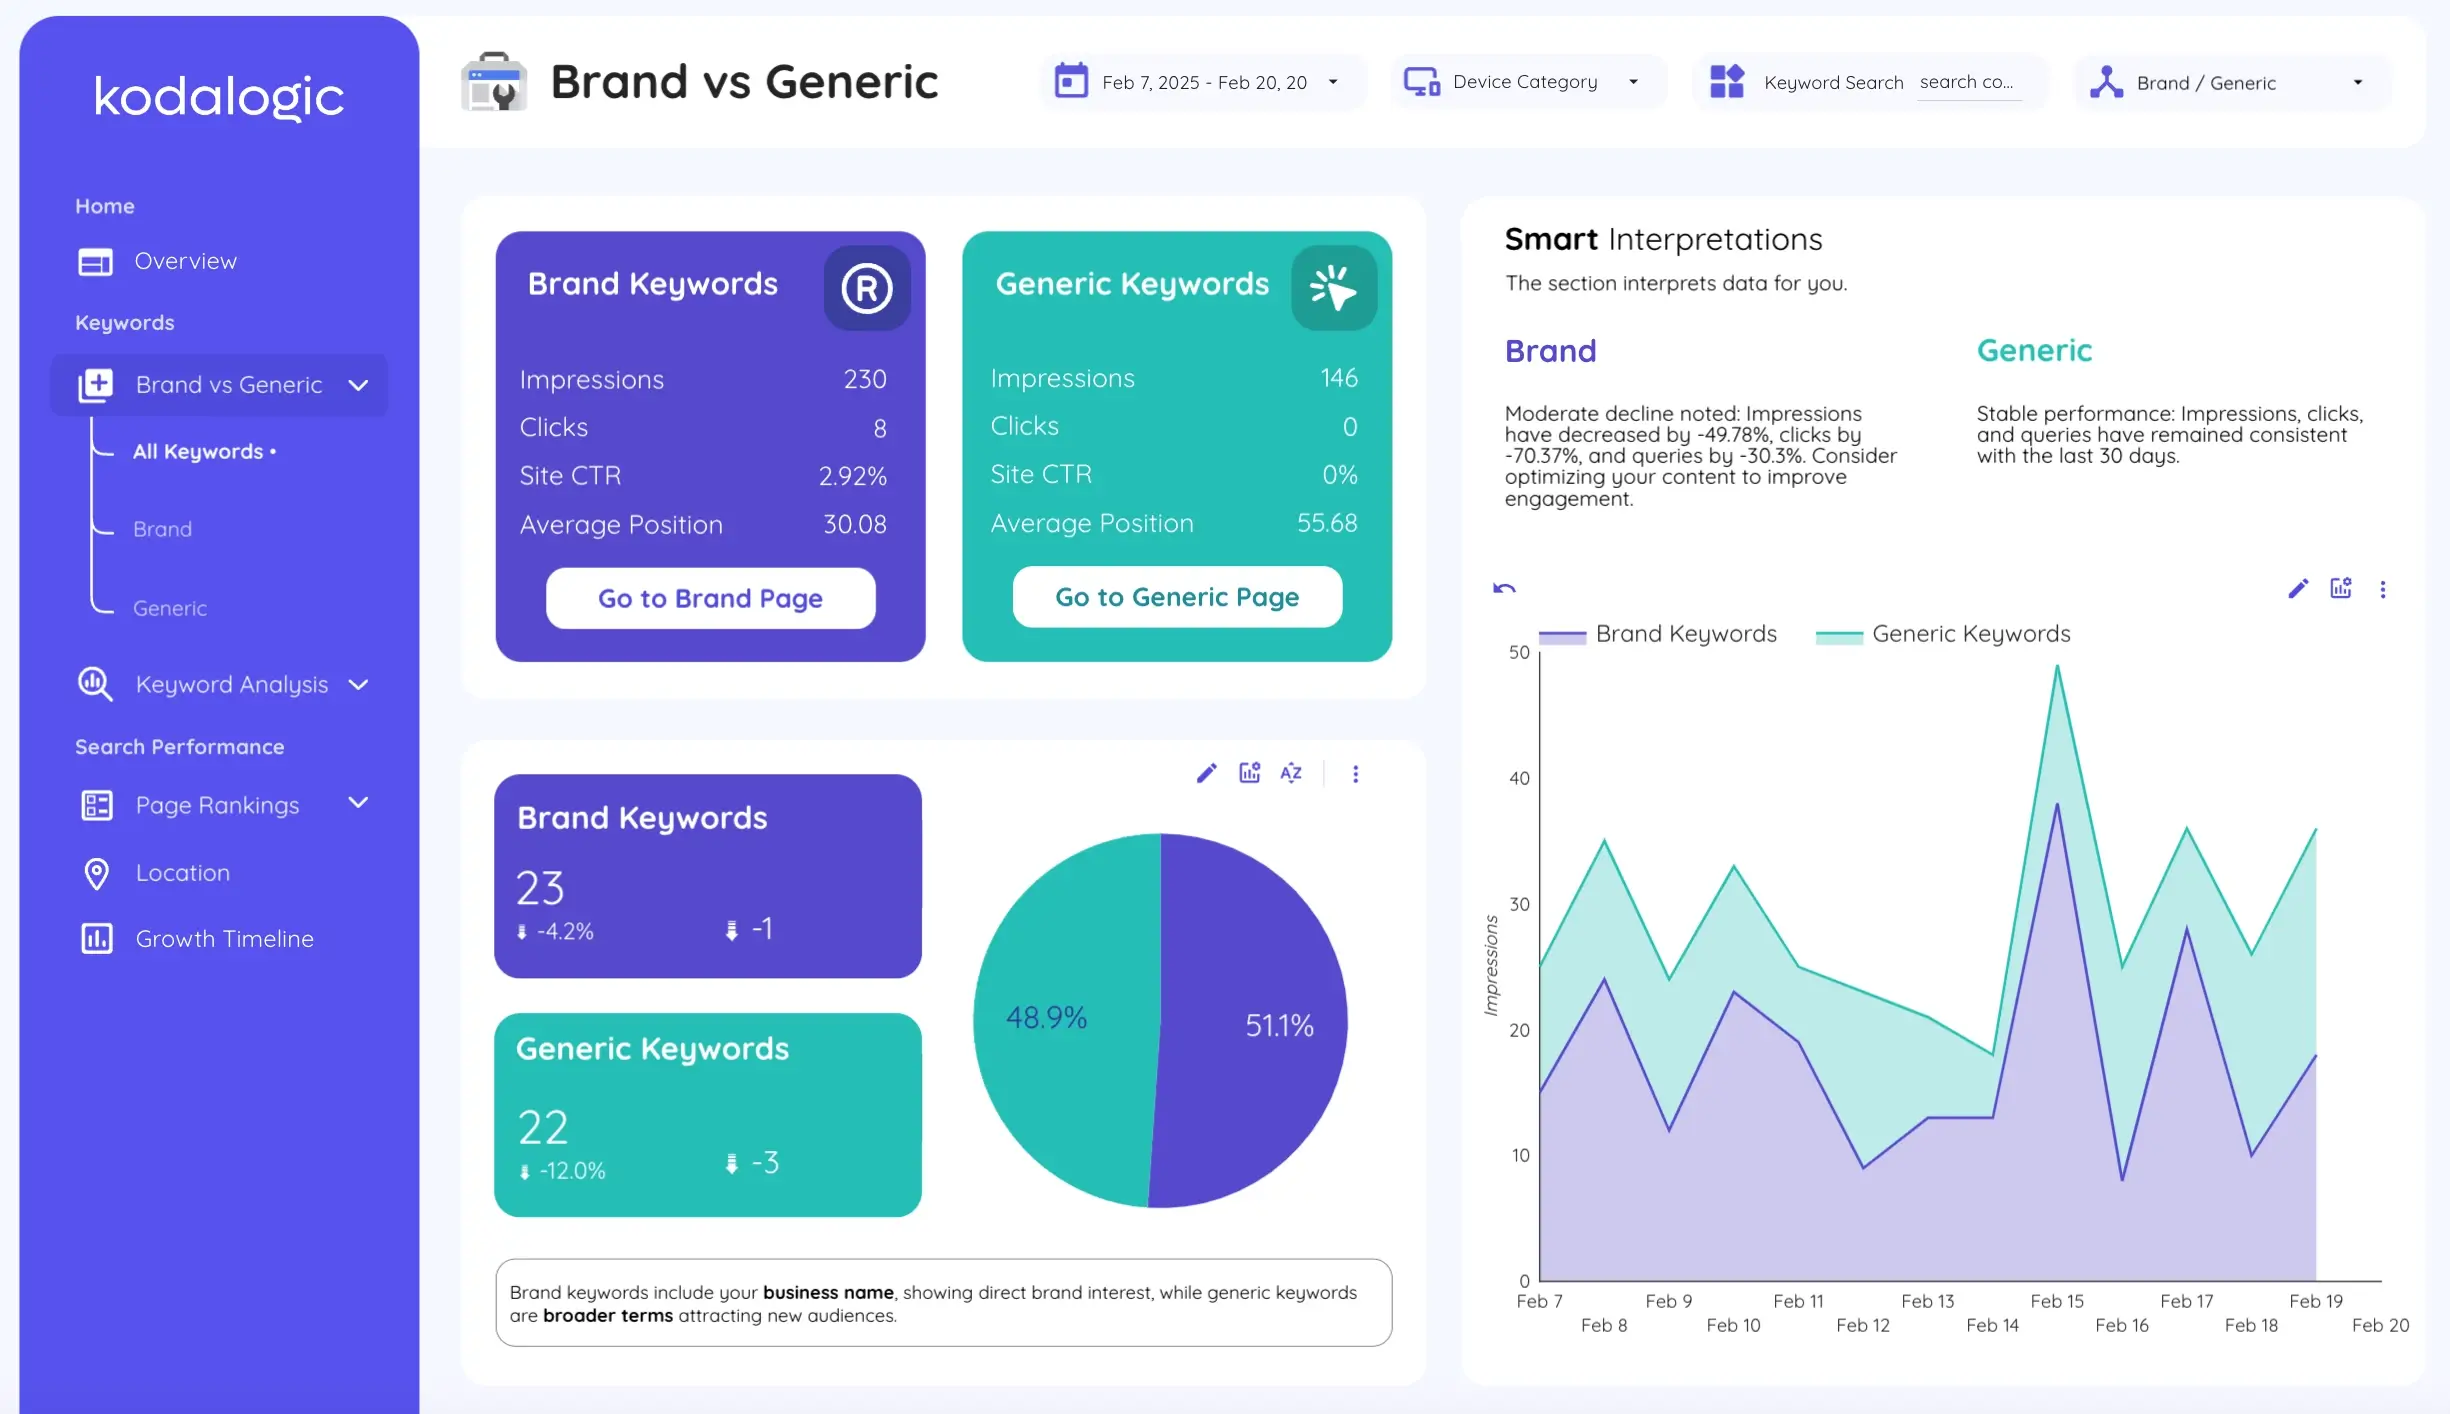
This is the section most keyword ranking reports skip — and the one that reveals the most about whether SEO is actually working.
Branded keywords are queries that include your company or product name. They have structurally higher CTR — often 15-40% for brand terms in positions 1-2 — and reflect existing awareness. Someone searching for your brand name is already on their way to your site. SEO did not create that demand.
Generic keywords are where SEO investment is supposed to create new demand. Informational queries where you appear to someone who has never heard of you. Commercial queries where your product page appears alongside competitors. These are the rankings that organic traffic growth depends on.
When branded and non-branded traffic get mixed into a single average position number, both stories disappear. Here is why this matters in practice:
A site whose branded impressions grow 40% month over month while generic impressions stay flat looks positive in aggregate. Average position improves. Clicks increase. The report looks fine. But generic SEO is completely stagnant. A product launch or a PR hit drove all the growth, and no one noticed because the branded keyword ranking report and the generic ranking report were never separated.
The branded vs non-branded split gives you two honest reads on performance. Both matter. They should never be in the same row.
2. Keyword Ranking Distribution: Position Bands Across Your Full Keyword Universe
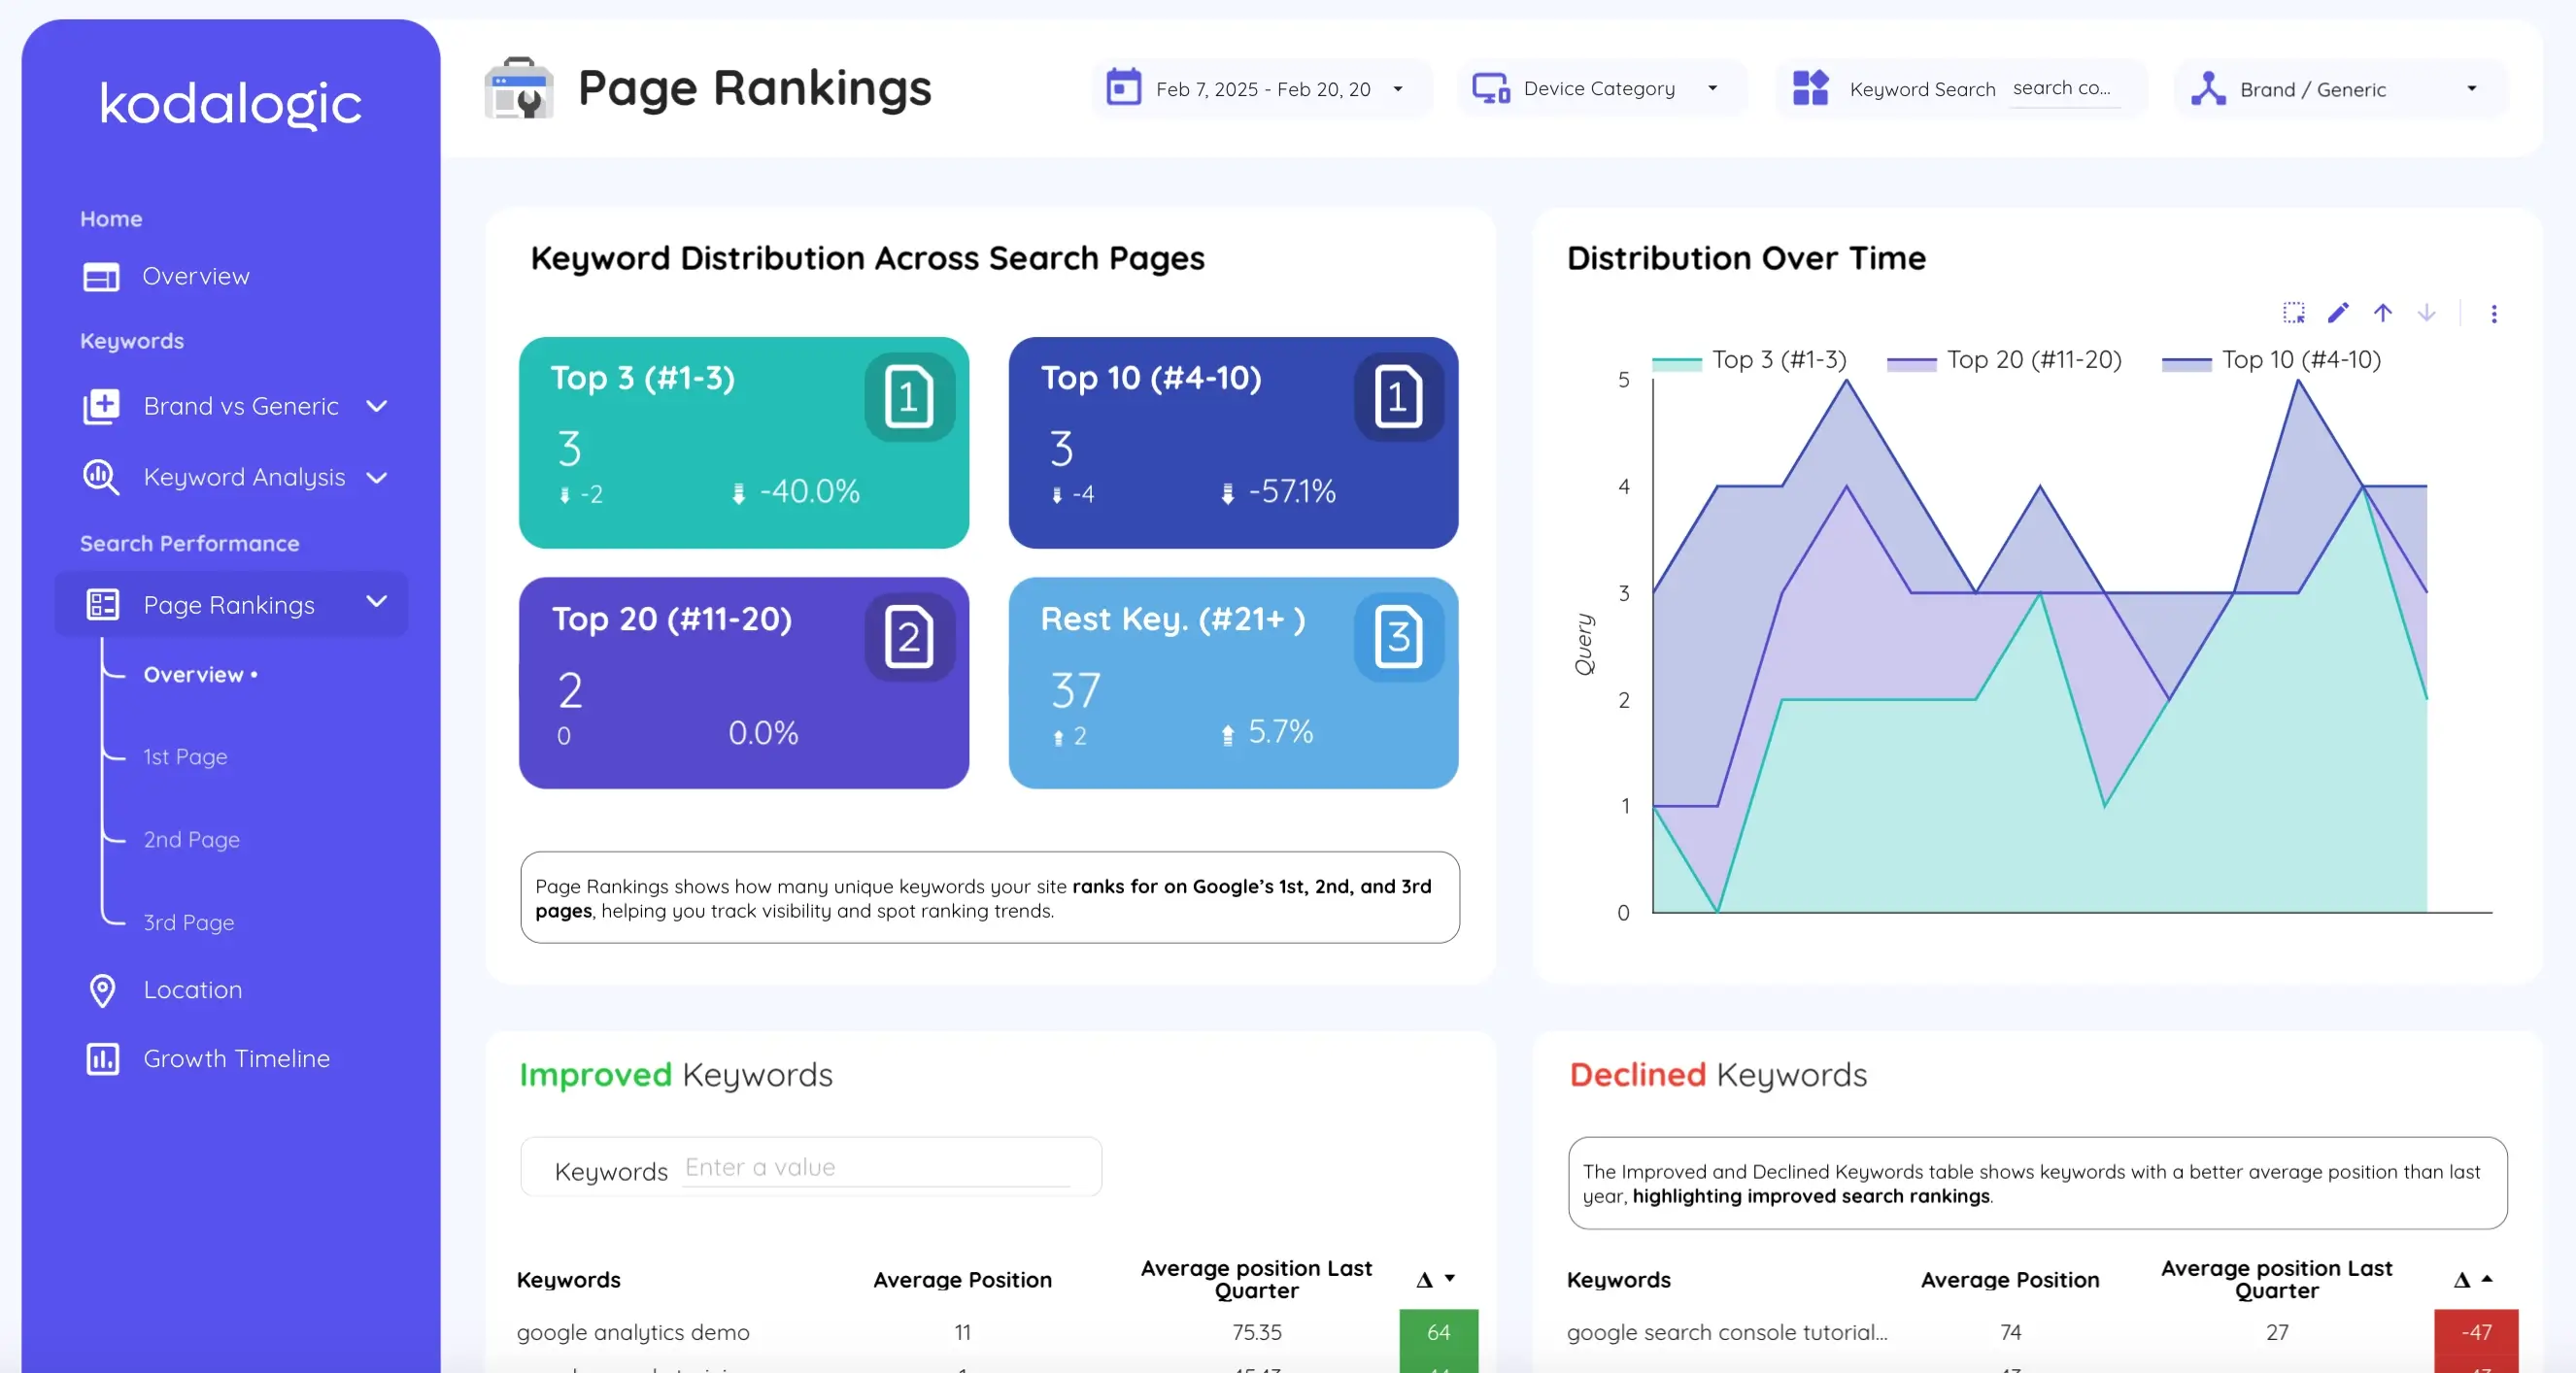
Average keyword position is one of the most misleading metrics in SEO reporting. A site with 50 keywords averaging position 12 and a site with 50 keywords averaging position 12 can have completely different organic traffic profiles. The distribution across position bands is what matters.
Here is why this section is essential in any keyword ranking report format:
Top 3 positions receive approximately 54% of all clicks on a search results page. A keyword in position 1 gets roughly 28% CTR. Position 3 gets around 11%. These are your traffic engines. Every keyword moved into this band has compounding effect on organic traffic.
Positions 4 to 10 — page one, below the fold — have CTR in the range of 2-8% depending on position and search type. This is the highest-leverage area for rank tracking investment. A keyword at position 7 with 500 monthly impressions might be getting 2.5% CTR (12 clicks). Move it to position 4 and CTR typically reaches 6-8% — a 3x organic traffic increase from a 3-position improvement.
Positions 11 to 20 — page two — receive approximately 0.5-1% CTR. Less than 1% of searchers reach page two. Keywords here need either active optimization to break into page one or honest deprioritization.
Beyond 20 — these keywords appear in Search Console but generate negligible traffic. They are either long-tail opportunities or topics you have not prioritized.
Important caveat for 2026: Google AI Overviews now appear for a significant share of informational queries, and they absorb clicks before users reach organic results. If your keyword ranking report shows a top-3 position with lower-than-expected CTR for informational terms, an AI Overview capturing the answer above your result is often the reason — not a snippet problem. SERP features (Featured Snippets, AI Overviews, People Also Ask boxes) affect CTR independently of position, so your ranking distribution analysis should account for which position bands are most exposed to these features. Position alone no longer predicts CTR with the same reliability it did two years ago.
The power of tracking keyword ranking distribution over time is in spotting structural shifts. When your page-two bucket shrinks and your positions-4-10 bucket grows, your SEO is working at scale — even if no individual keyword movement appears dramatic.
3. Keyword Movement Tracking: Historical Data as an Early Warning System
Most ranking drops do not appear in organic traffic data until they have been happening for weeks. By the time clicks decline, the position has often been slipping for a month. Historical ranking data is the mechanism that catches this early.
A proper keyword movement section in your SEO keyword ranking report shows:
Rising keywords: queries that improved in average position since the comparison period, with the magnitude of improvement. A keyword moving from position 14 to position 9 is a breakthrough — it crossed from page two to page one. Show the start position, end position, and delta. Show it for the top 20 risers sorted by magnitude.
Falling keywords: queries that declined, with magnitude. A keyword that falls from position 8 to position 18 has effectively disappeared from page one. That is a content quality or competitive signal that requires immediate attention — not a note for next month's report.
Rank tracking at scale means this section updates automatically from your historical Search Console data. You are not building a spreadsheet of position snapshots. You are reviewing what shifted since the last period and acting on it.
For keywords gaining positions: understand what changed and replicate it. For keywords losing positions: act before the organic traffic impact appears.
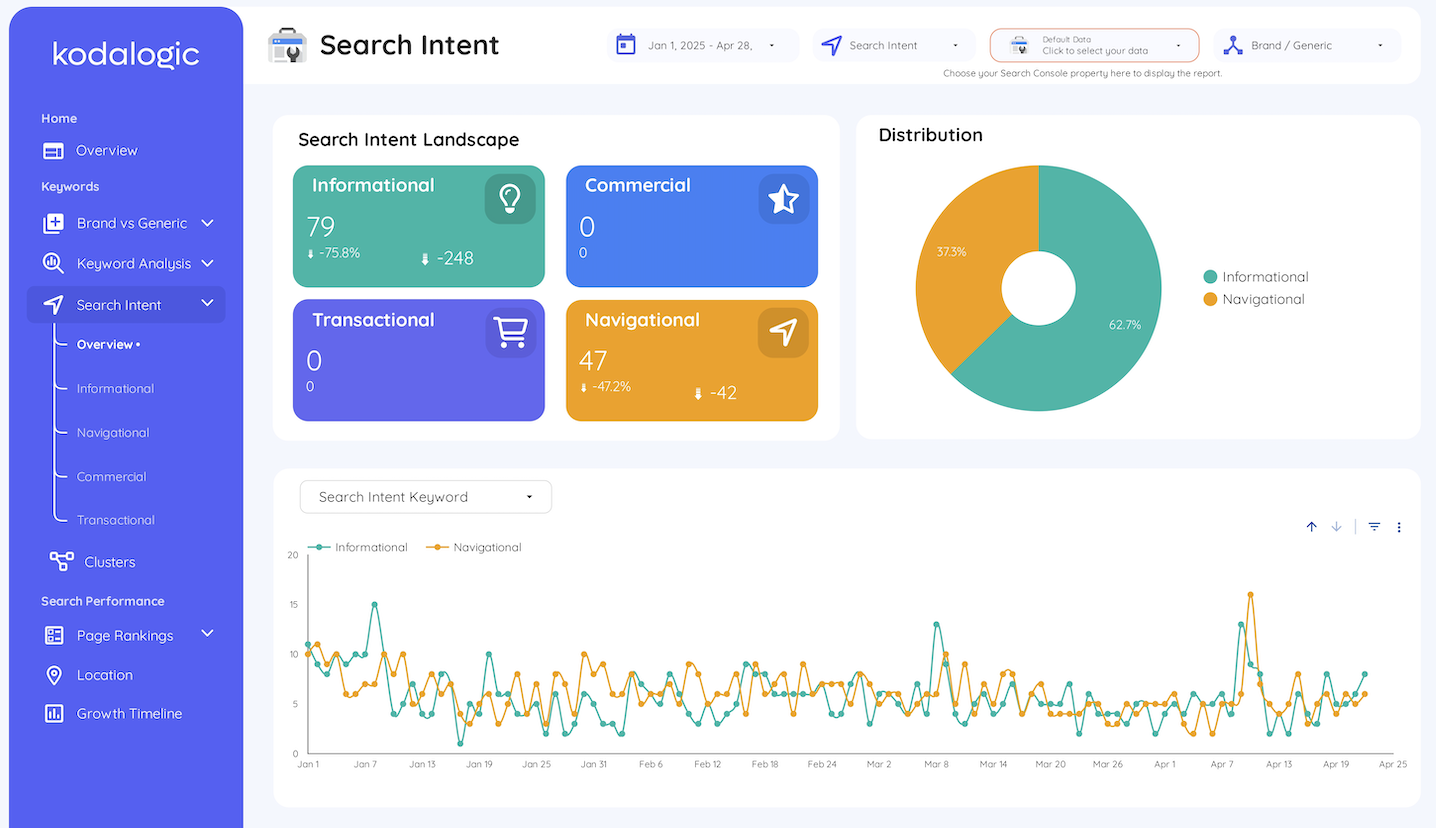
4. Search Intent Classification: Informational, Navigational, Commercial, Transactional
A keyword ranking report without intent context forces manual judgment calls on every single query. At 100 keywords that is manageable. At 1,000 it is not.
Intent classification organizes your keyword universe into four types:
Informational — queries where the user wants to learn something. These typically convert at low rates but build topical authority. Ranking well here also increases the risk of AI Overview visibility reducing your CTR, so it is worth monitoring CTR benchmarks specifically for this intent category.
Navigational — queries where the user is heading somewhere specific. Often brand terms. CTR is high because the user already knows where they want to go.
Commercial — queries where the user is evaluating options. High-value rankings to pursue. Users in this category are comparing before deciding.
Transactional — queries where the user is ready to act. If you rank position 12 for a transactional keyword in your core category, that is a direct organic traffic and revenue problem — not an optional optimization.
Knowing a keyword is transactional changes how urgently you treat a position 12 ranking. Knowing it is informational changes whether you invest in pushing it to position 1 or target a featured snippet instead. This is the section that separates a keyword ranking report built for analysis from one built for decoration.
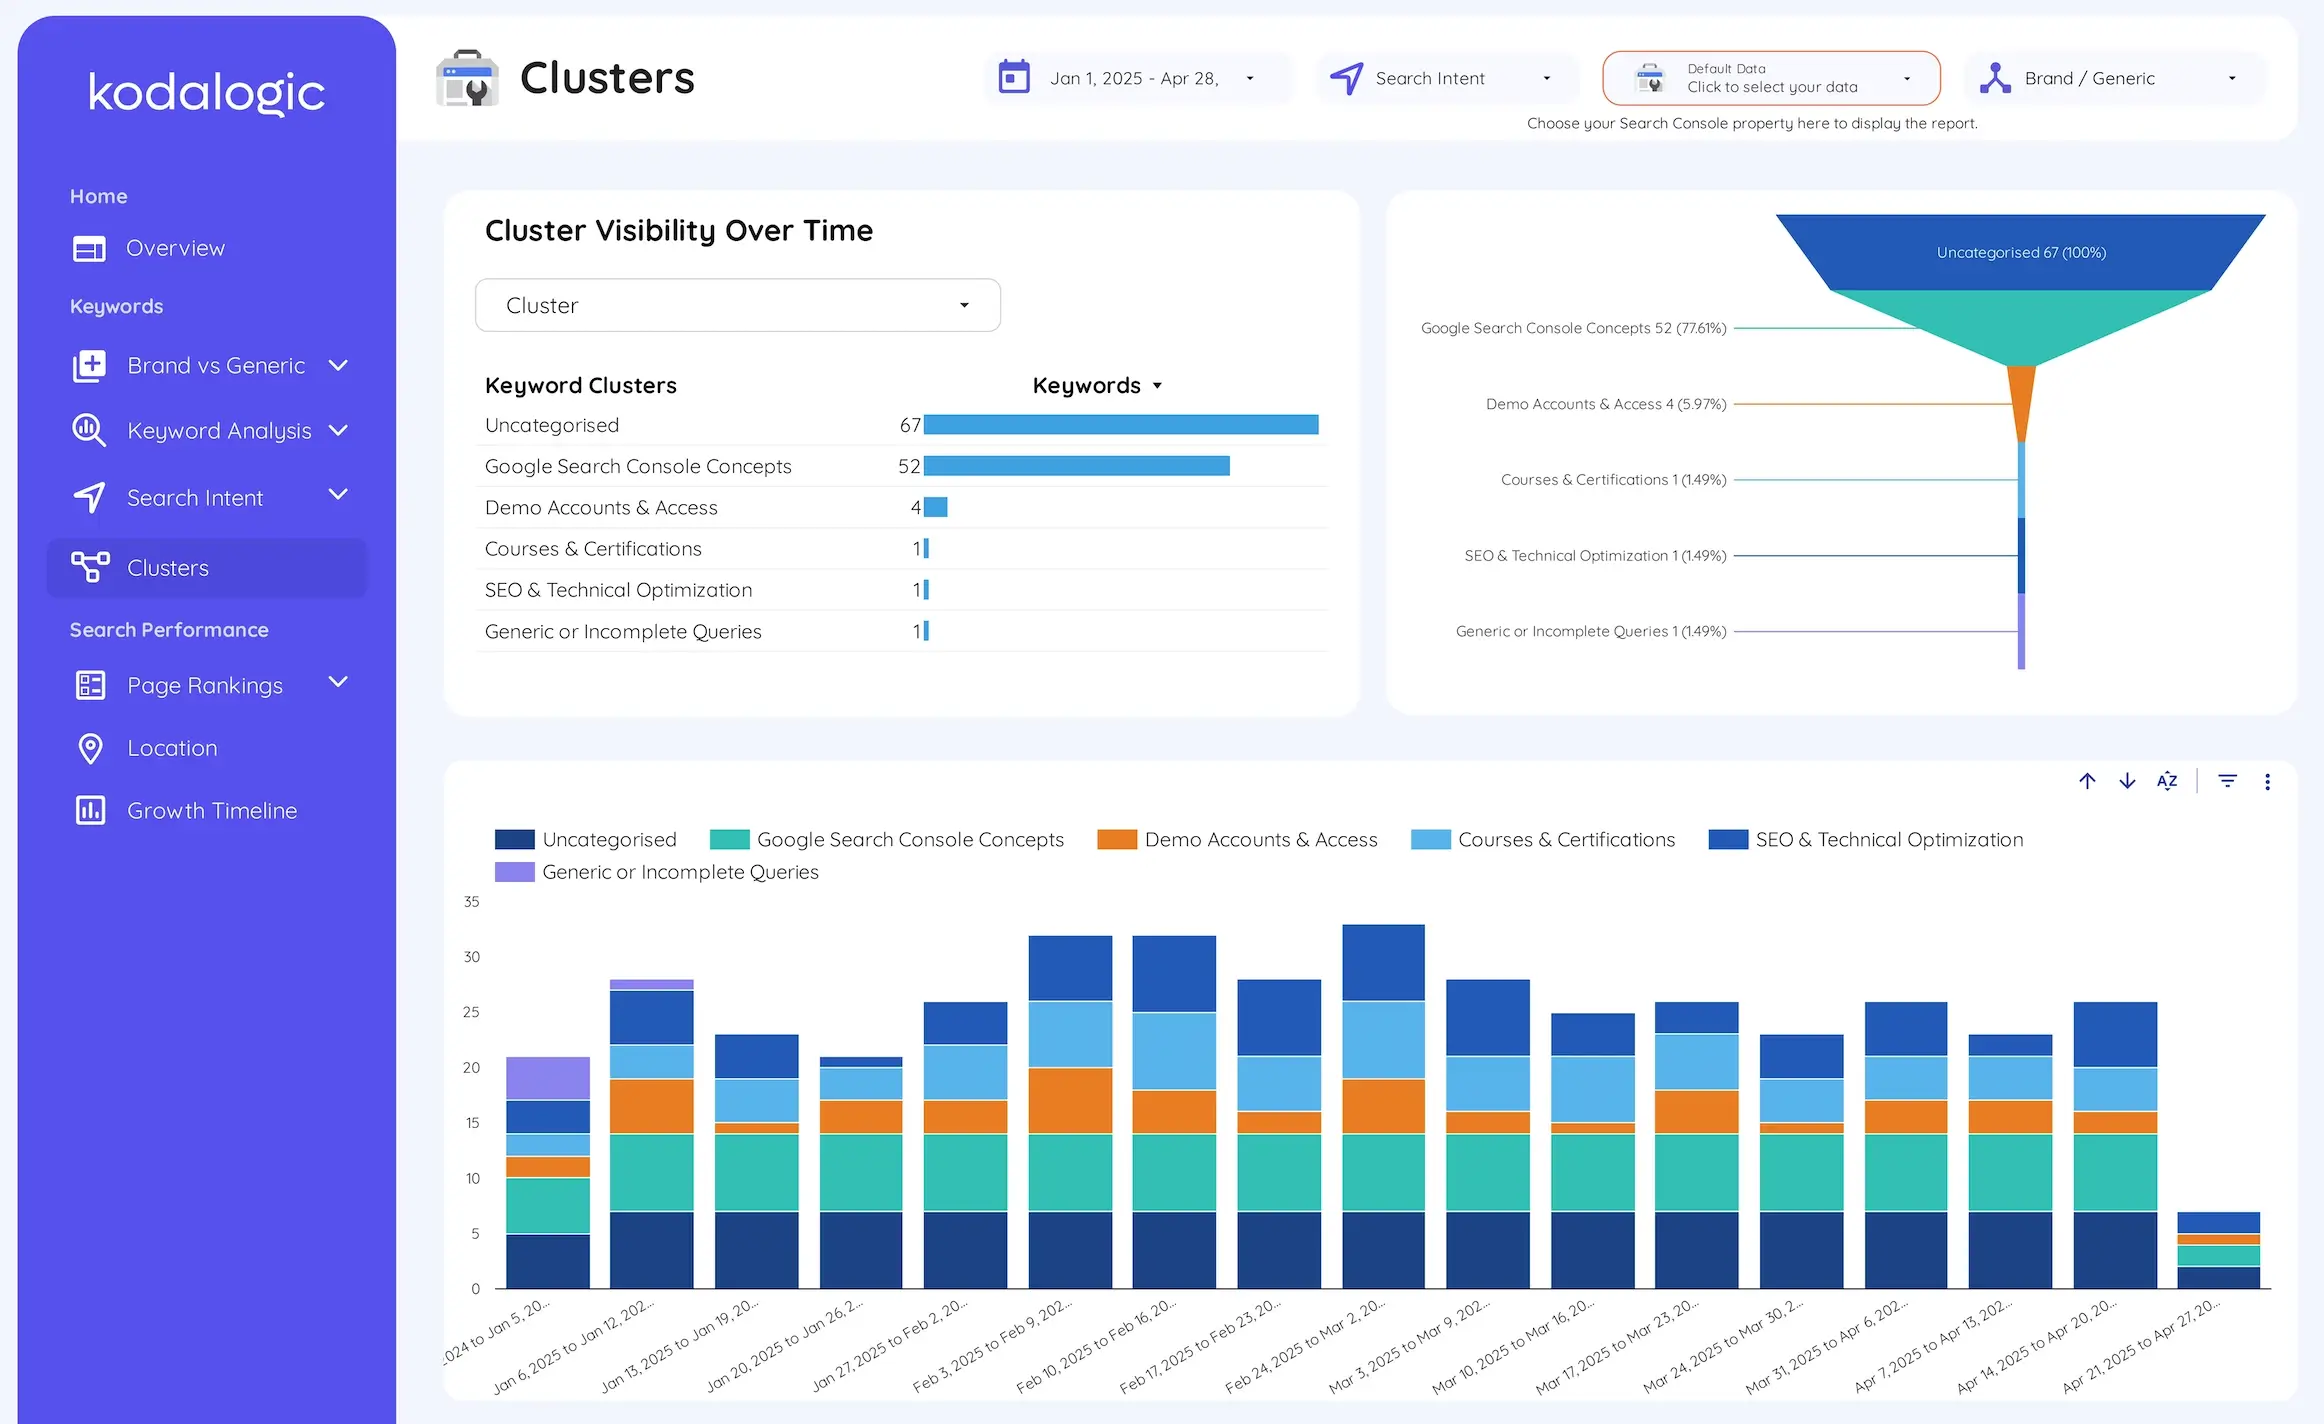
5. Keyword Clusters: Topic-Level Performance
Individual keyword positions fluctuate constantly. Reacting to every movement is exhausting and counterproductive.
Keyword clustering groups semantically related queries so you evaluate performance at the topic level rather than the query level.
Here is what this looks like in practice. A site publishing content about Google Search Console integrations might define a cluster around that topic — all queries containing "search console," "GSC," "search performance," and related terms. When that cluster collectively moves from average position 22 to average position 15 over six weeks, the content strategy for that topic is working, even if no single keyword shows dramatic improvement. When it declines collectively, the topic needs attention before any individual ranking becomes an organic traffic problem.
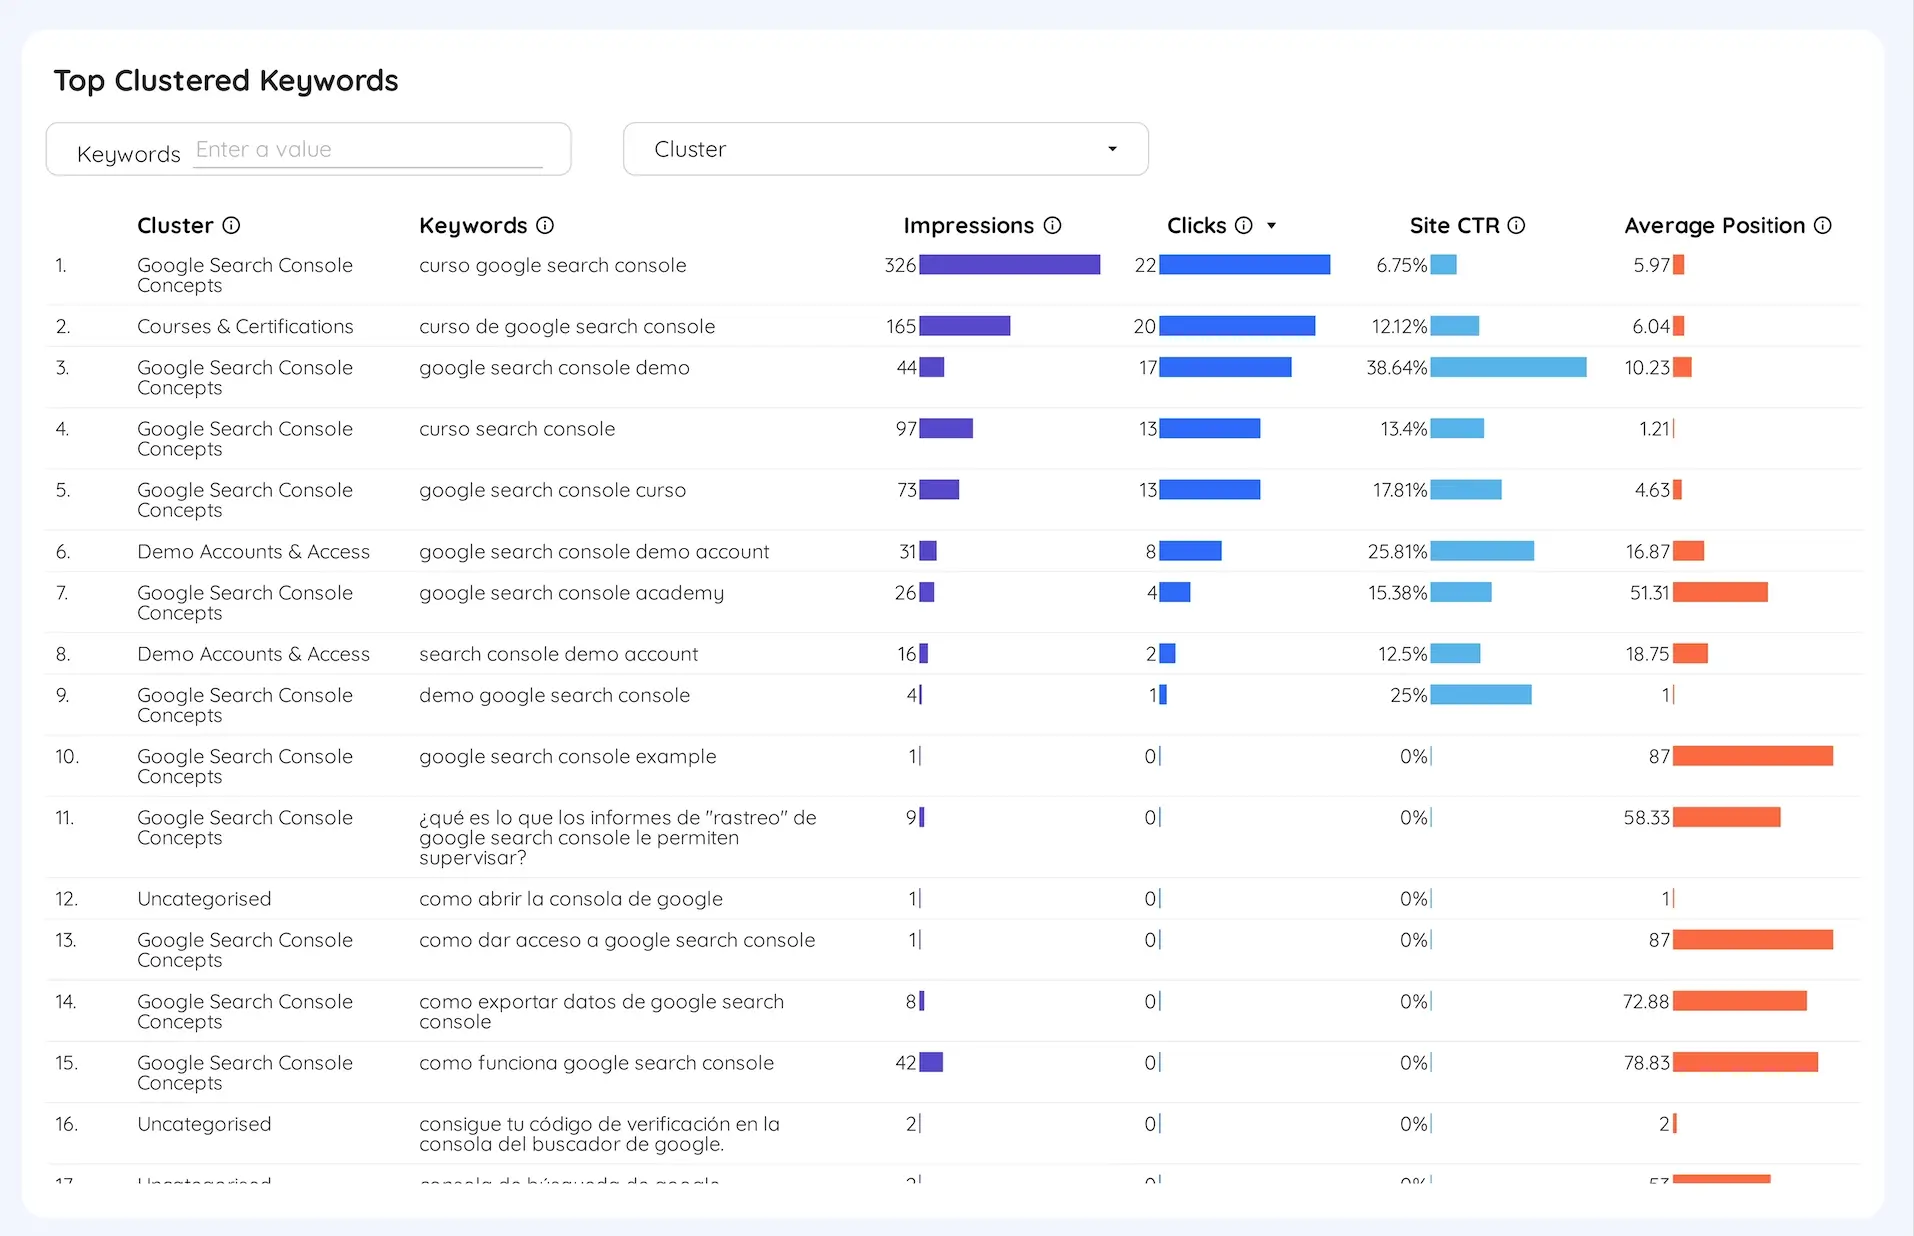
The cluster view connects keyword data to content strategy in a way that individual rank tracking cannot. It answers the question content teams actually need: is our investment in this topic paying off?
6. Head Terms vs Long-Tail Keywords: Where Your Organic Traffic Actually Comes From
Head terms (1-3 words) have high search volume, high competition, and slow movement. They often reflect broad intent that is hard to match precisely. A position 15 ranking for "seo dashboard" generates minimal traffic but tells you something about how Google sees your domain's relevance.
Long-tail keywords (4+ words) are more specific, convert at higher rates, and often rank faster because competition is lower. Studies consistently show long-tail keywords convert at 2-3x the rate of head terms for the same topic. They are also where the 91.8% of all search queries that never appear in broad keyword research live — specific enough to attract qualified organic traffic without the competition of high-volume terms.
This section of the keyword ranking report shows which type is driving your clicks, which has CTR gaps, and where content investment should go next.
7. Geographic and Device Performance
A keyword at position 4 in Spain might be at position 22 in Latin America. A campaign targeting UK clients might be getting most of its impressions from India. A product that converts on desktop might be getting most of its organic traffic from mobile.
These gaps are real optimization opportunities that aggregate ranking data conceals entirely.
The geographic section shows impressions, clicks, CTR, and average position broken down by country — with the top-performing market surfaced automatically and the ability to drill into any specific geography. Device breakdowns show whether mobile and desktop users are having the same experience of your rankings, which they often are not.
The Automated SEO Report: How Looker Studio Changes the Workflow
The manual version of everything described above takes hours. You download Search Console data, import it to a spreadsheet, build the brand vs non-branded filter, create the ranking distribution bands, calculate the position deltas for rank tracking, classify intent manually, group keywords into clusters by hand. By the time it is done, the data covers a period already in the past.
An automated SEO report in Looker Studio connected to Search Console runs this analysis continuously. Every section updates automatically when new Search Console data comes in. Historical ranking data stays accessible without any export process. You do not build the report — you review it.
According to research from Swydo on agency reporting workflows, manual SEO analysis runs 4-5 hours per client per month. With proper automation, that drops to 15-30 minutes. For a ten-client agency, that gap is 40-50 hours of monthly reporting overhead — recovered or lost depending on your setup.
We cover the scheduling side separately — how to set up automatic email delivery so your keyword ranking report reaches whoever needs it, on whatever cadence you need — in our guide on how to schedule a Looker Studio dashboard for email delivery.
Google Search Console vs Rank Trackers: Which Do You Need?
Most dedicated rank tracker tools — Semrush, Ahrefs, SE Ranking, AccuRanker, AgencyAnalytics — offer keyword position tracking at subscription costs ranging from $100 to $300+ per month. They add daily refresh rates, competitor position tracking, and Bing coverage.
Google Search Console provides first-party data directly from Google, free, with 16 months of historical ranking data. The positions it reports are the positions Google actually uses — there is no discrepancy between the data and what Google measures, which dedicated rank trackers occasionally produce.
The Kodalogic dashboard connects to Search Console directly — no additional subscription, no third-party data layer, no reconciliation between what Google reports and what your rank tool shows.
If you need to track keyword rankings on Bing, monitor competitor positions by keyword, or need daily rather than 48-hour data refresh, a dedicated rank tracker is worth considering alongside a Looker Studio dashboard. For automated SEO reporting based on actual Google organic traffic data, Search Console connected to Looker Studio is both more accurate and more cost-effective.
The dashboard also supports white label reporting — your clients see a report with your branding, not a Kodalogic interface.
What the Dashboard Shows on Day One
When you connect the Kodalogic Google Search Console template to your property, every section described above is ready with your data:
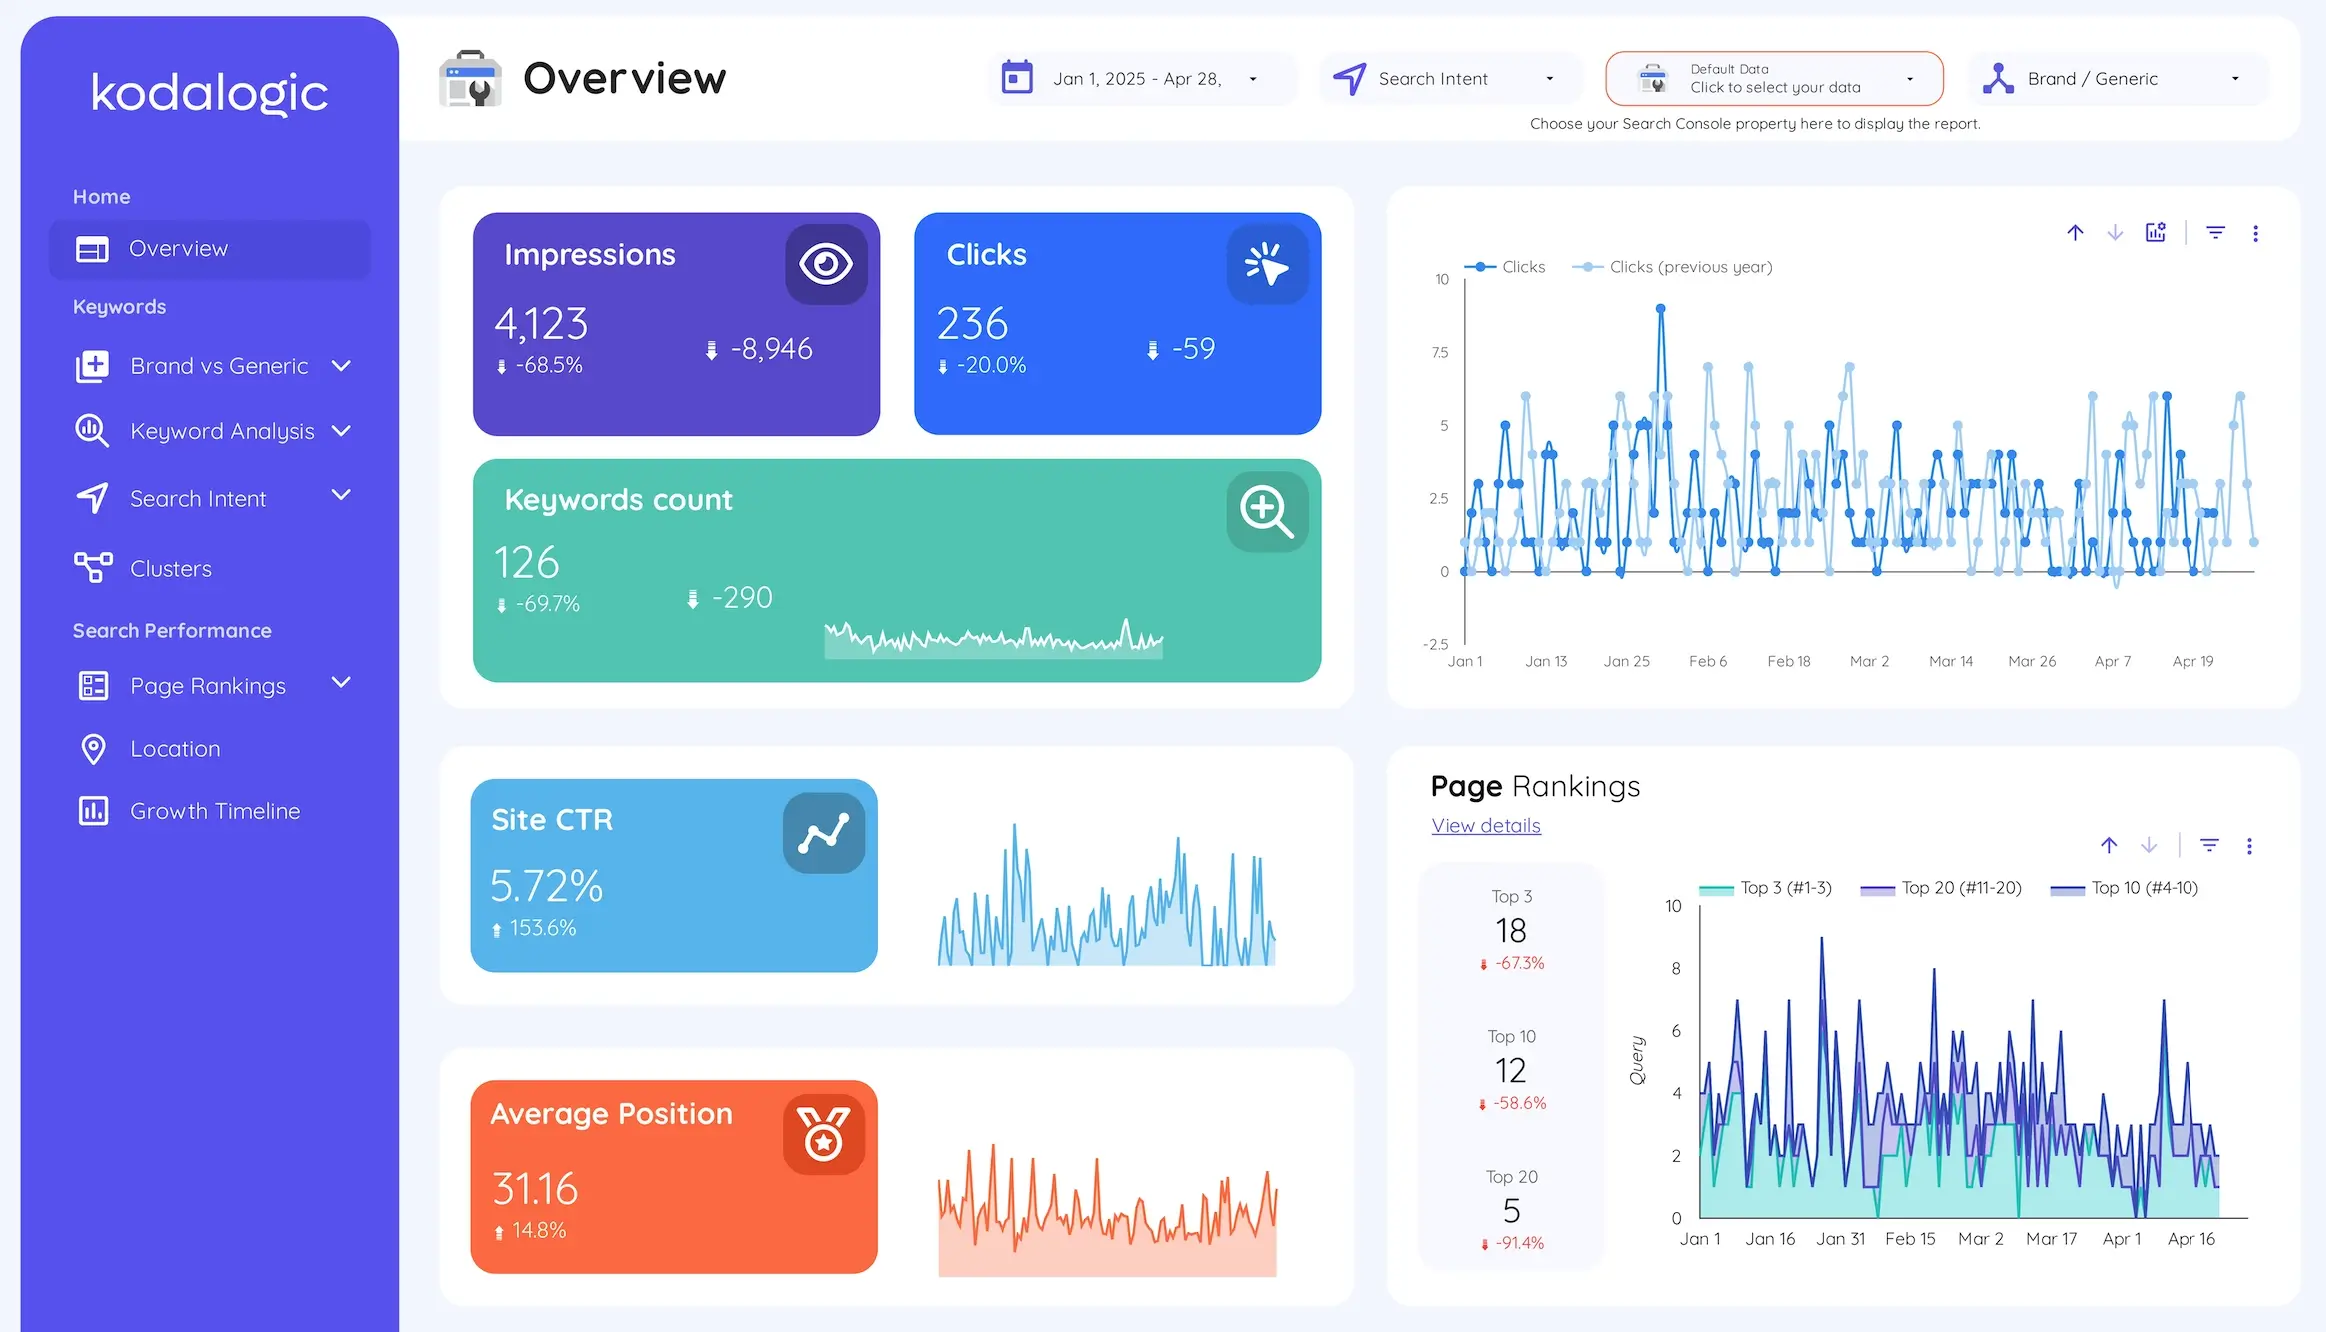
Overview — total impressions, organic traffic clicks, CTR, and average position with period-over-period comparison. The health check in five seconds.
Brand vs Generic — your keyword universe split into branded and non-branded tracks. Separate CTR, impressions, and organic traffic metrics for each.
Intent Classification — your queries classified by informational, navigational, commercial, and transactional intent, with distribution percentages and performance by category.
Clusters — your keyword universe grouped by topic. Visibility trend by cluster across your historical ranking data.
Ranking Distribution — position bands (top 3, 4-10, 11-20, beyond 20) updated continuously, showing whether your distribution is shifting over time.
Keyword Movement — which queries gained and which fell since the comparison period, with magnitude, not just direction.
Head Terms vs Long-Tail — performance by keyword length. Which type drives organic traffic, which has CTR gaps.
Location — geographic breakdown of impressions, clicks, CTR, and average position by country. Top market surfaced automatically.
Smart Interpretations — written analysis of what changed and what it means. Updated automatically. No prompting. No interpretation session required.
Smart Interpretations is a Kodalogic-exclusive feature. It reads your live Search Console data and generates plain-language summaries of what is happening across your ranking distribution, brand vs non-branded split, CTR gaps, and cluster performance. No other public Looker Studio SEO dashboard or keyword ranking report template has this. For more detail on how it works, see our guide: What Is Smart Interpretations?
Building This Yourself vs Using a Template
Building the keyword ranking report format in this guide from scratch in Looker Studio requires configuring the Search Console connection, writing the brand vs non-branded classification logic, building the cluster framework with calculated fields, creating the position band distribution, writing the intent classification system, and designing a layout your clients can actually use.
For an experienced Looker Studio user, this takes 8-12 hours for a single property. For someone newer to the platform, it takes considerably longer — and the risk of configuration errors (broken blending, misconfigured comparison periods, incorrect calculated fields) is real.
The Kodalogic Google Search Console Dashboard has all of this already built. Connect your property, and the keyword ranking report format described in this guide is ready with your actual data.
For a single site: professional-grade automated SEO reports from day one. For an agency: a consistent, scalable reporting foundation that replicates across clients in under two minutes per property — with white label options for client-facing delivery.