Integrating Google Analytics data into a dashboard lets you see key website metrics in one organized view. Whether you are tracking campaign performance, traffic. User behavior, here is a step-by-step guide to easily connect Google Analytics to a dashboard and get valuable insights fast.
Step 1: Access Google Analytics and Configure Your Property
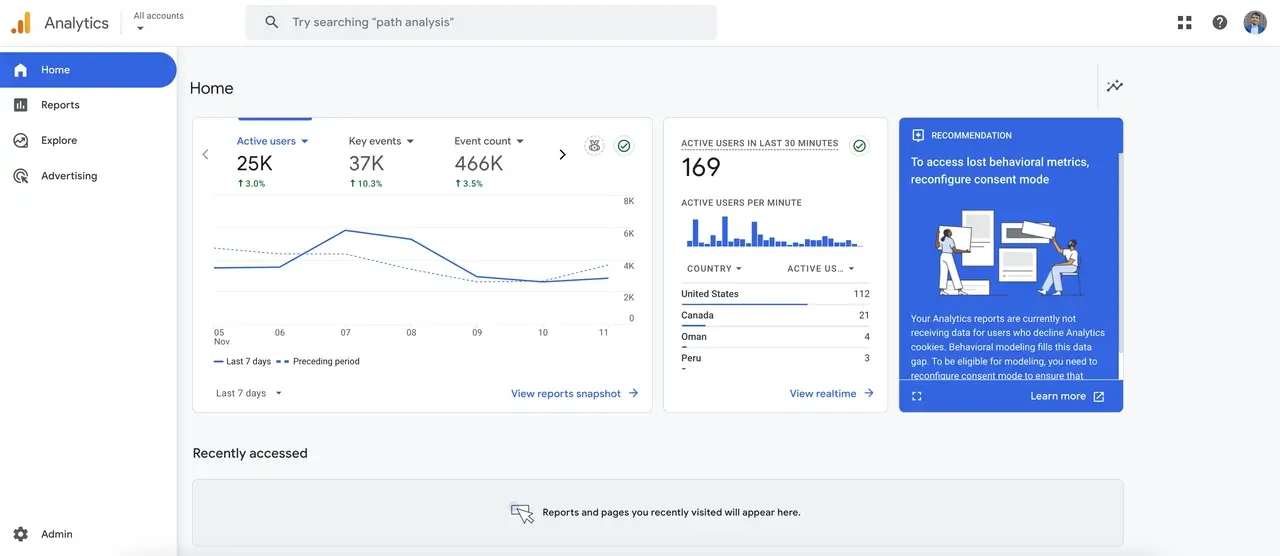
Before connecting Google Analytics to a dashboard tool, make sure you have access to the correct data. This means:
- Your Google Analytics account is set up and tracking your website data.
- You have access to the data you want to display on your dashboard.
- Your account is using Google Analytics 4 (GA4), as this is the latest version.
Step 2: Choose Your Dashboard Platform

There are different platforms to create dashboards, each with unique features. Here is a comparison of the most popular options and why Looker Studio is ideal for connecting Google Analytics data.
| Platform | Advantages | Refresh Rate | Connection Time | Ease of Use | Drawback |
|---|---|---|---|---|---|
| Looker Studio | Connects directly with Google Analytics; free; highly customizable visual design. | 1 to 12 hours | 1-2 minutes | Very easy | Not ideal if you need to upload data from files like Excel. |
| Tableau | Advanced tool for complex analysis and interactive charts. | Depends on third-party connectors | 15-20 minutes | Medium | Does not connect directly to Google Analytics, requiring extra setup. |
| Power BI | Great for corporate-level analysis of large datasets from various sources. | Depends on third-party connectors | 20-30 minutes | Medium-hard | Requires an extra connector for Google Analytics data and has a learning curve. |
Conclusion: Looker Studio is the best choice for most marketing needs due to its easy setup, direct connection to Google Analytics, and user-friendly interface.
Step 3: Connect Google Analytics to the Dashboard Platform
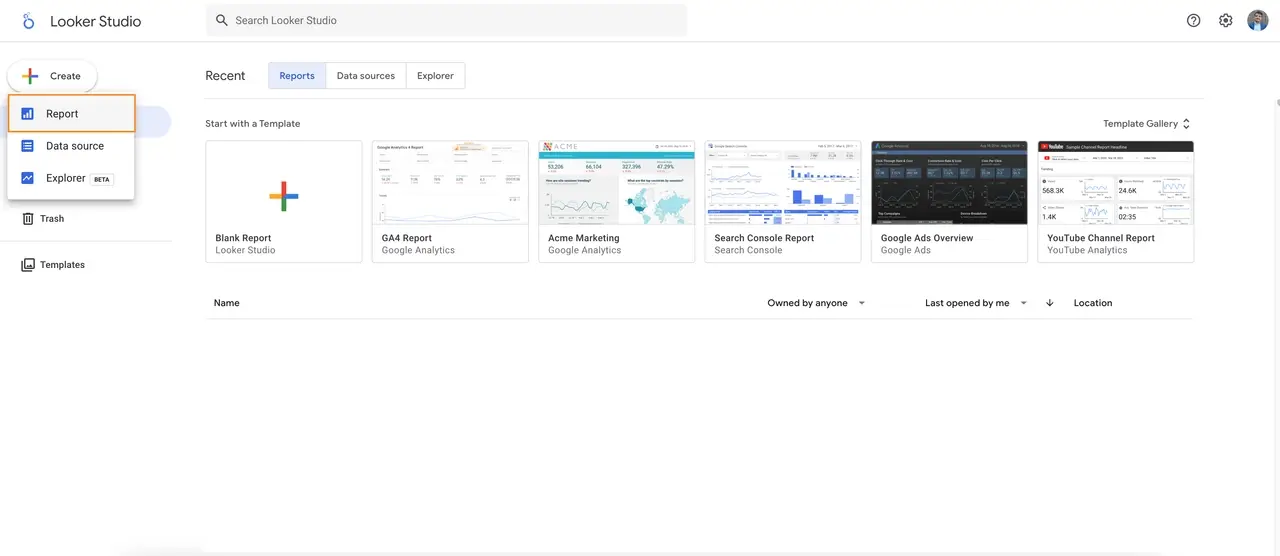
Each dashboard tool has a unique way of connecting with Google Analytics. Here is how to do it in Looker Studio:
- Open Looker Studio and click Create to start a new report.
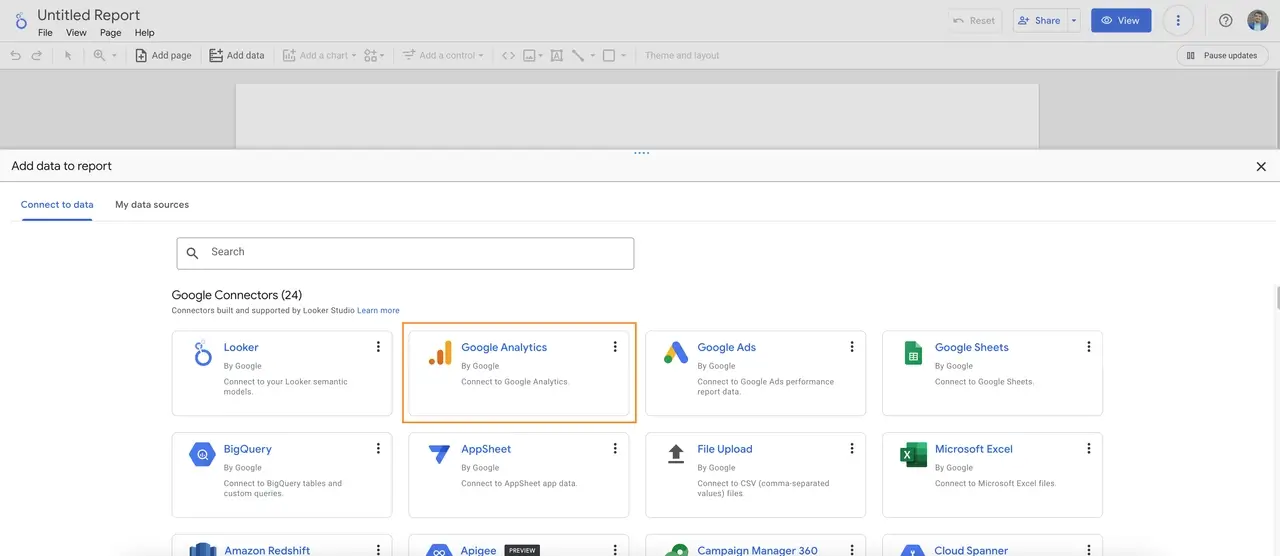
- In the data source options, select Google Analytics.
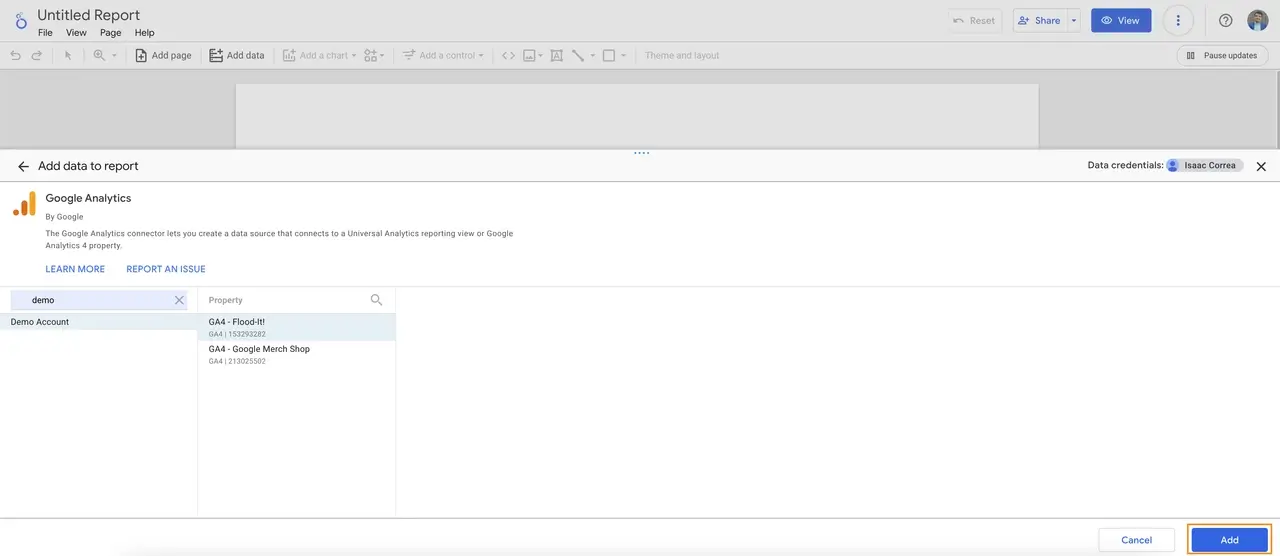
- Choose the account you want to connect and the specific data view.
- Click Connect to link the data to your dashboard.
Step 4: Choose the Metrics and Data to Display
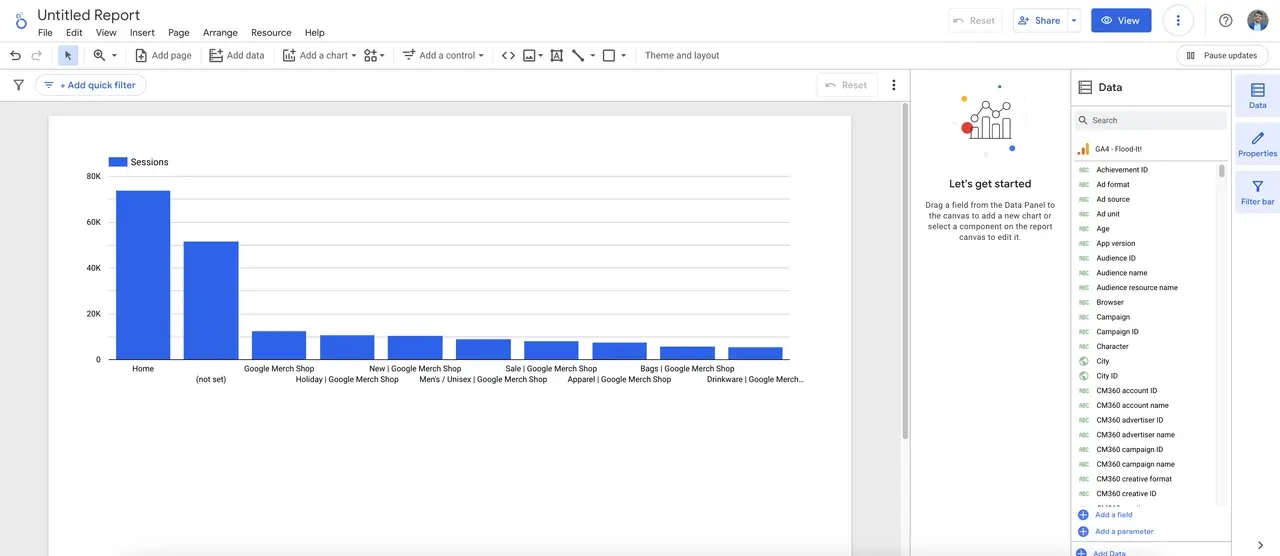
Once connected, decide on the key data you want to see on your dashboard. Some common examples for marketing include:
- Total visits and active users (to track your audience size).
- Conversion rate and goal completions (to measure success).
- Average visit duration and pages viewed (to see engagement).
- Bounce rate and traffic sources (to know where visitors come from).
Step 5: Customize the Dashboard Design
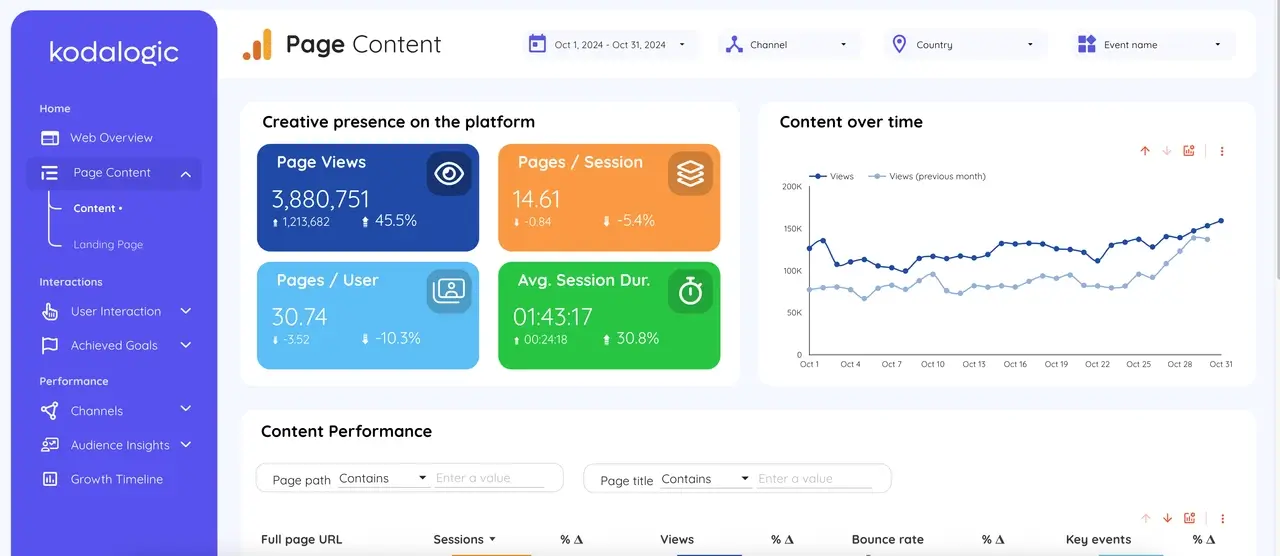
To make your dashboard visually clear and easy to understand:
- Organize the elements: Place the most important data at the top for quick viewing.
- Use appropriate charts: For example, use bar charts for comparisons, line charts for trends, and tables for detailed information.
- Keep the style consistent: Use colors and fonts that match your brand for a professional look.
A well-organized dashboard makes it easier for anyone to understand the data at a glance.
Starting Out? Why a Template Might Be the Best Option
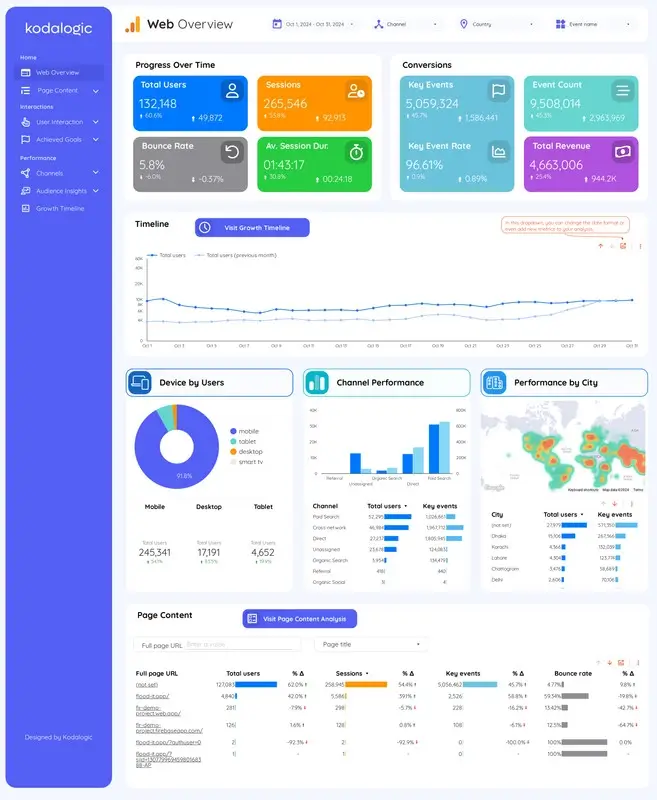
Building a dashboard from scratch can take time, especially if you want it to look polished and professional. It involves more than just adding data; it is also about creating a layout that is visually engaging and easy to understand.
If this is your first time setting up a dashboard, we highly recommend starting with a template. Templates guide you through the design process, showing the essential components of a high-quality dashboard while saving you time and effort.
Explore our Looker Studio templates to see how our carefully designed templates can transform your data into clear, actionable insights. Starting with a template lets you focus on your data, while we handle the design for you.

Written by
Isaac CorreaHe runs the commercial side of Kodalogic and co-founded Hellomatik. Before that he built more than two hundred Looker Studio dashboards for clients, and collected 107 five-star reviews doing it.