GA4 + Google Ads Dashboard for Data Studio





4.98 from 103 reviews in 27 countries: read them
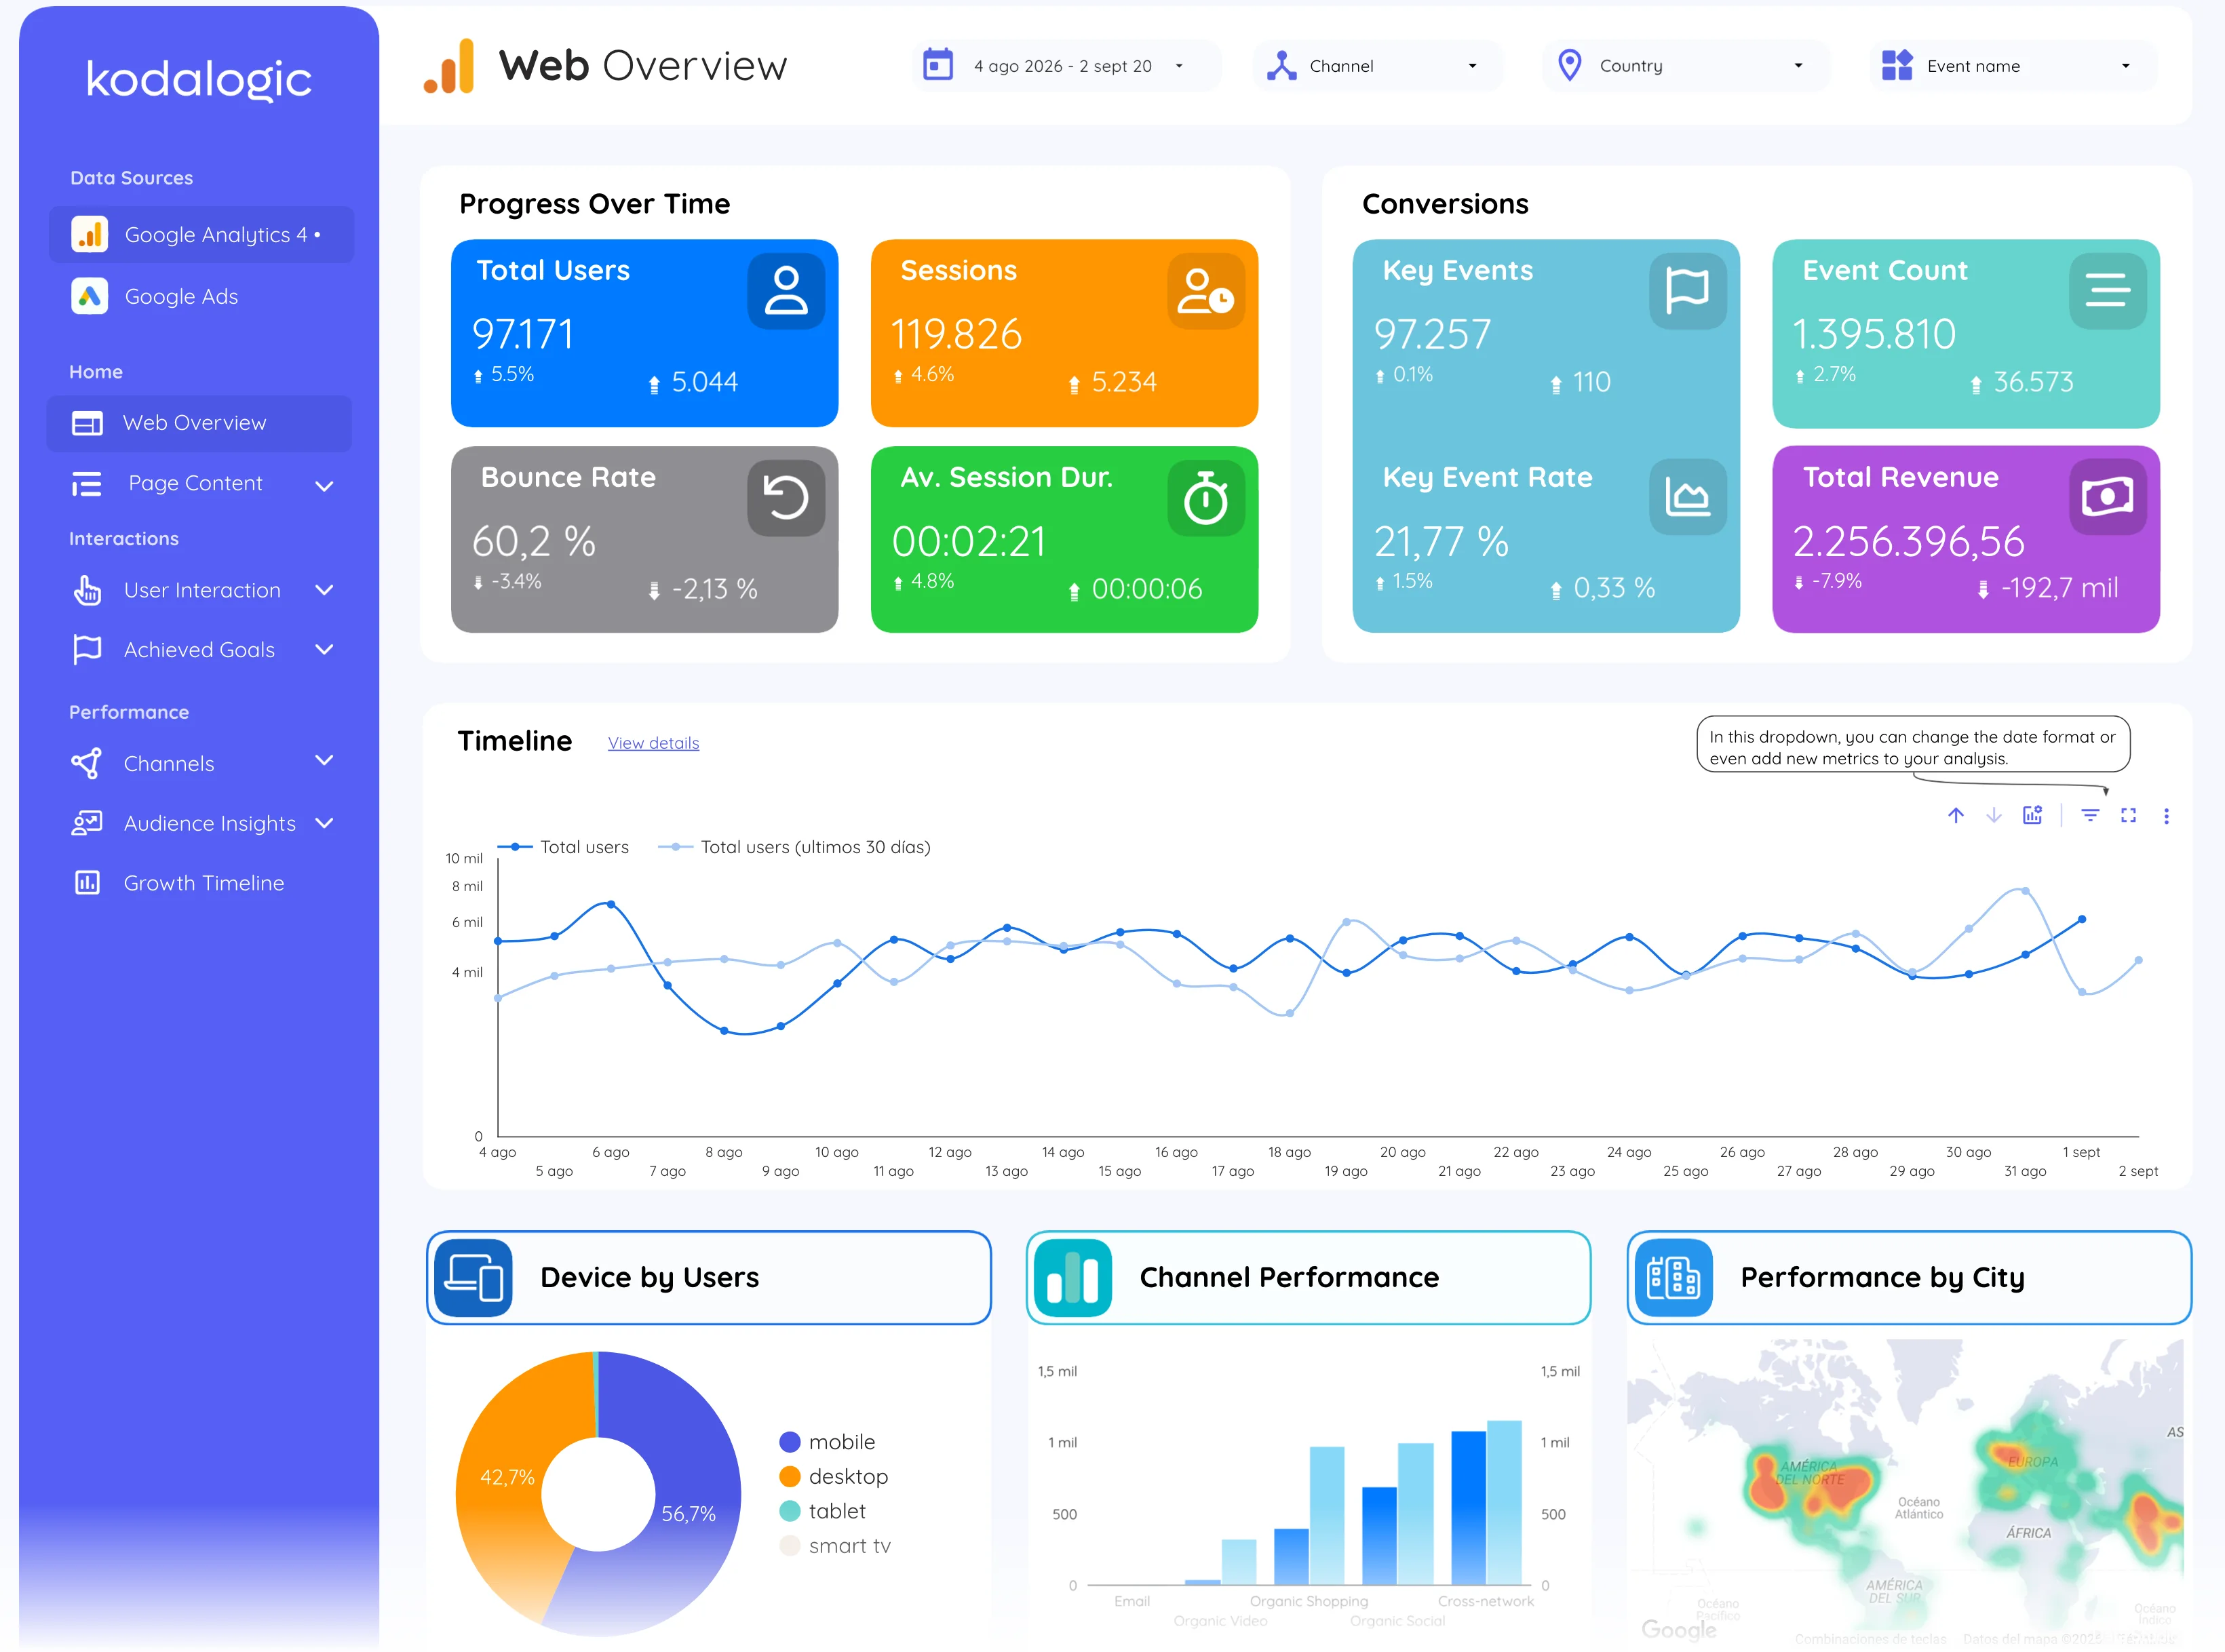
Web overview · Page 1 of 22
See it in motion
17 seconds of the live report, page by page.
Traffic and ad spend, page by page
22 pages in the report. The 12 in the gallery above are the ones you will use weekly, each with what it answers and its page open in the live demo.


What happens after the click, users, sessions, bounce, key events and revenue.
Every number against its previous period, so a change is visible, not calculated.
Which campaigns land on pages that leak, the question a single-source report cannot answer.
Ads and GA4 on the same dates, one link instead of two exports.
The long version
A Google Ads report tells you whether a campaign spends efficiently. It cannot tell you whether the traffic it buys actually converts, engages or bounces the moment it lands. This dashboard closes that gap: Google Ads performance, campaigns, keywords, spend, ROAS and conversions, alongside the GA4 behavior of the very traffic those ads generate, in one Looker Studio file with 22 real pages.
The GA4 half shows what happens after the click: users, sessions, bounce, key events and revenue with period-over-period deltas, the landing pages that earn the sessions, the e-commerce funnel from product view to purchase, and the channel table where paid sits next to organic, direct and referral. The Ads half shows what the clicks cost: impressions, conversions, cost and revenue with CPC and CPM trended, campaign distribution with the top performers called out, and match-type keyword analysis down to the actual user search terms.
What clients say about working with kodalogic
4.97 out of 5 across 103 verified reviews. Around 400 dashboards built since 2022, for clients in 50+ countries. The same team builds every template. Read all of them · verify them on Fiverr.
- 5 stars
- 102
- 4 stars
- 1
- 3 stars
- 0
- 2 stars
- 0
- 1 star
- 0
He was very knowledgeable with Data Studio/Looker and helped me so much. When it was time to make changes, he was very responsive and accommodating. He is a happy and hard-working person and I can tell that he enjoys his work and helping his clients very much. I would say he went above and beyond in terms of being responsive and accommodating to all of the requested edits. I will definitely use him again and highly recommend him to anyone who needs expertise with reporting dashboards.

I recently worked with Kodalogic on a Google Looker Studio Dashboard, and the experience was fantastic. He designed an impressive dashboard and skillfully fixed errors in an older one. His communication was clear, and his expertise was evident throughout the project. I'm absolutely satisfied with his work and will definitely be collaborating with him again. Highly recommended!

I had a great experience with him. He helped me make a report using Google Looker Studio, with data from Facebook Ads and Google Ads. He knew a lot about these and made a really good report. I asked for many changes, and he did all of them without any problems. He was very patient and made sure I was happy with everything. I'm 100% satisfied with his work. He's the best!

What you get with every template
Everything below comes with the one-time price, and the three steps under it are all it takes to have the report running on your data.
- Full edit access from day one
- Your logo, colors and theme
- Unlimited copies and accounts
- Share and schedule deliveries
- Export chart data to Sheets
- Setup guide and support included
Set up in three steps
No connectors to install and no extra accounts. You copy the report into your own Data Studio and point it at your property.
- Step 1
Open your template
After checkout you get the link straight away, with the setup guide next to it.
- Step 2
Connect your account
Copy the report and pick your own property when Data Studio asks for the data source.
- Step 3
Your data is in
Every page fills with your numbers. Rename it, drop in your logo, share the link.
What this dashboard measures
33 metrics and 26 dimensions on 12 of the report's 22 pages, each one explained.
Read from the live demo. Dotted links open the glossary definition; solid links open the field reference. Page numbers are the report's own.
- Page 01Web overview
- Page 02Page content
- Page 03Landing page
MetricsSessionsViewsBounce rateKey events
Broken down byLanding pagePage pathPage titleDate
- Page 07Conversions
MetricsKey EventsEvent CountKey Event RateTotal Revenue
Broken down byEvent nameDevice categoryChannelCity
- Page 08E-commerce
- Page 09Channels
- Page 11Paid channels
- Page 14Growth timeline
- Page 15Ads overview
- Page 16Campaigns
- Page 19Keyword analysis
- Page 22Ads growth timeline
Before you buy
Questions people ask first
Because a free template is a layout, not a report. This one ships twenty-two finished pages, each built around a question a client actually asks, with the metrics already chosen and named, and Smart Interpretations writing the reading of the data in plain language. A free gallery template gives you charts and leaves the thinking to you, every month.
No, it is one report. Web, SEO and ads live on the same pages, over the same dates, so a client sees how the three move together instead of opening three files and comparing them by hand. Buying the three sources separately would give you three reports; this gives you one.
Yes. Google renamed Looker Studio to Data Studio in 2026; the product, the connectors and the reports are the same. Every template here is a Data Studio template and works in the free version, whichever name your account shows.
Three steps, about ten minutes. Open the template link and make a copy into your own Data Studio account; connect each data source to your property, account or site with Google’s native connector; then share the copy by link or schedule its delivery. The setup guide that comes with every purchase walks each step with screenshots.
Yes. The demo is the same report, running on demo data. When you connect your own property the layout, pages and charts stay as you saw them: the numbers become yours.
Yes. It works with whatever you already have in GA4. If something is not configured yet, or a client has not set it up, nothing breaks: those figures stay hidden until the data is connected, and then they fill in on their own.
You get the template link plus written setup instructions that walk you through connecting your own data and customising the report.
Write to us. Technical support to resolve issues is part of what you buy, not an add-on.
Yes. Copy it, brand it and use it across the clients you manage. What you cannot do is resell the template itself as a product.
No. One payment, and the template is yours.
Other dashboards
This dashboard covers 2 data sources in one report. If you only need one of them, these go deeper on it. Compare all six side by side.
Read the deep dive
We have written these features up in full: what they do, why they matter and how to use them once the report is connected.
- Track ROAS and conversions without the spreadsheetThe PPC half of this report: which metrics drive decisions, plus ROAS and conversion-rate benchmarks by industry.
- GA4 dashboard: automate reports in minutesThe GA4 half: how the traffic pages are built and what each one is for.
- The PPC report that runs itselfWhy connecting paid data to on-site behaviour changes budget decisions, and how the two sources sit in one report.
Take GA4 + Google Ads Dashboard for Data Studio home.
One-time payment · lifetime updates · prices in USD · no taxes charged. See it running with real data before you pay.
$214
- probar
Open the full report with real data before you pay: every page, no account, nothing to imagine.
- entrega
Your link lands in your inbox right after payment. You copy the report into your own Google account.
- licencia
Unlimited copies and client accounts: one purchase covers every client you report for.
- factura
Automatic invoice with your company and tax number, issued the moment you pay. Prices in USD, nothing added at checkout.
Sold by Kodalogic, Avenida de Leonardo Da Vinci 8, Getafe (Madrid), Spain. Company details