06 of April of 2026
Best Looker Studio Templates for 2026: The Ones That Actually Save You Time

Isaac Correa
Looker Studio Templates
Data Integration & Sources
SEO & Marketing Dashboards
Most Looker Studio templates look good in a screenshot and break the moment you connect your data. These don't. Here's what makes each one worth using — and which one fits your situation.
Most Looker Studio templates look impressive in a preview and fall apart the moment you connect your data. The ones worth using are built around what you actually need to report — not around what looks good in a screenshot.
What Makes a Looker Studio Template Worth Using
Before getting into specific templates, it's worth being clear about what separates a good one from a bad one. Because there are thousands of Looker Studio templates out there — on the Looker Studio gallery, on third-party marketplaces, on random blog posts — and most of them share the same problems.
They show you data without telling you what it means. A table of sessions and a line chart of impressions is not a dashboard. It's a data dump with a logo on it. A good template structures data so the story is obvious without extra analysis.
They're not built around how real reporting works. Most free templates are built to look comprehensive, not to be used weekly. They cram every metric into one view and leave you with no clear place to start.
They break when you change the date range or add a filter. Anyone who has worked with Looker Studio knows how quickly a badly built template produces errors, blank charts, or metrics that don't match what Search Console or GA4 actually shows.
The templates worth using have a clear structure, connect cleanly to your data sources, and tell you something useful the moment they load. That's the standard everything below is held to.
The Kodalogic Looker Studio Templates — What's Actually in Each One
These are the templates we build and maintain at Kodalogic. Each one connects directly to Google's data sources — no third-party connectors, no middleware — and includes Smart Interpretations, our feature that reads your live data and writes the analysis for you.
Here's what each one includes and who it's built for.
1. All-in-One Marketing Dashboard — GA4 + Google Search Console + Google Ads
Best for: Marketing teams and agencies that manage paid and organic together and need one place to see how they interact.
Data sources: Google Analytics 4, Google Search Console, Google Ads
What it shows:
The GA4 module covers user behavior, sessions, engagement rate, conversions, and page-level performance. The Google Ads module tracks campaign spend, ROAS, keyword performance, audience segmentation by device and demographics, and conversion data. The Search Console module adds organic keyword rankings, CTR trends, brand versus generic split, and high-performing pages.
Why it's different:
Most all-in-one dashboards just put three separate dashboards side by side. This one is designed to show how your paid and organic channels interact — so you can see when a keyword you're bidding on is already ranking organically, or when a page with strong SEO traffic has a low conversion rate that paid traffic is masking.
Smart Interpretations runs across all three modules and surfaces the connections automatically.
Price: from $289 one-time payment
→ See the All-in-One Dashboard
2. Web & SEO Performance Dashboard — GA4 + Google Search Console
Best for: SEO professionals, content teams, and site owners who want to connect traffic behavior to search performance without adding Google Ads to the mix.
Data sources: Google Analytics 4 + Google Search Console
What it shows:
GA4 covers web traffic, user behavior, engagement, and conversions. The Search Console module adds organic visibility — which queries are driving traffic, how CTR changes by position, which pages are gaining or losing ranking ground, and how branded versus non-branded search is evolving.
Why it's different:
GA4 tells you what users do on your site. Search Console tells you how they found it. Separately, both tools leave gaps. Together, in a single dashboard, you can answer questions like: why did traffic drop on this page even though the ranking stayed the same? Or: this query has 2,000 impressions and zero clicks — what's wrong with the snippet?
Price: from $214 one-time payment
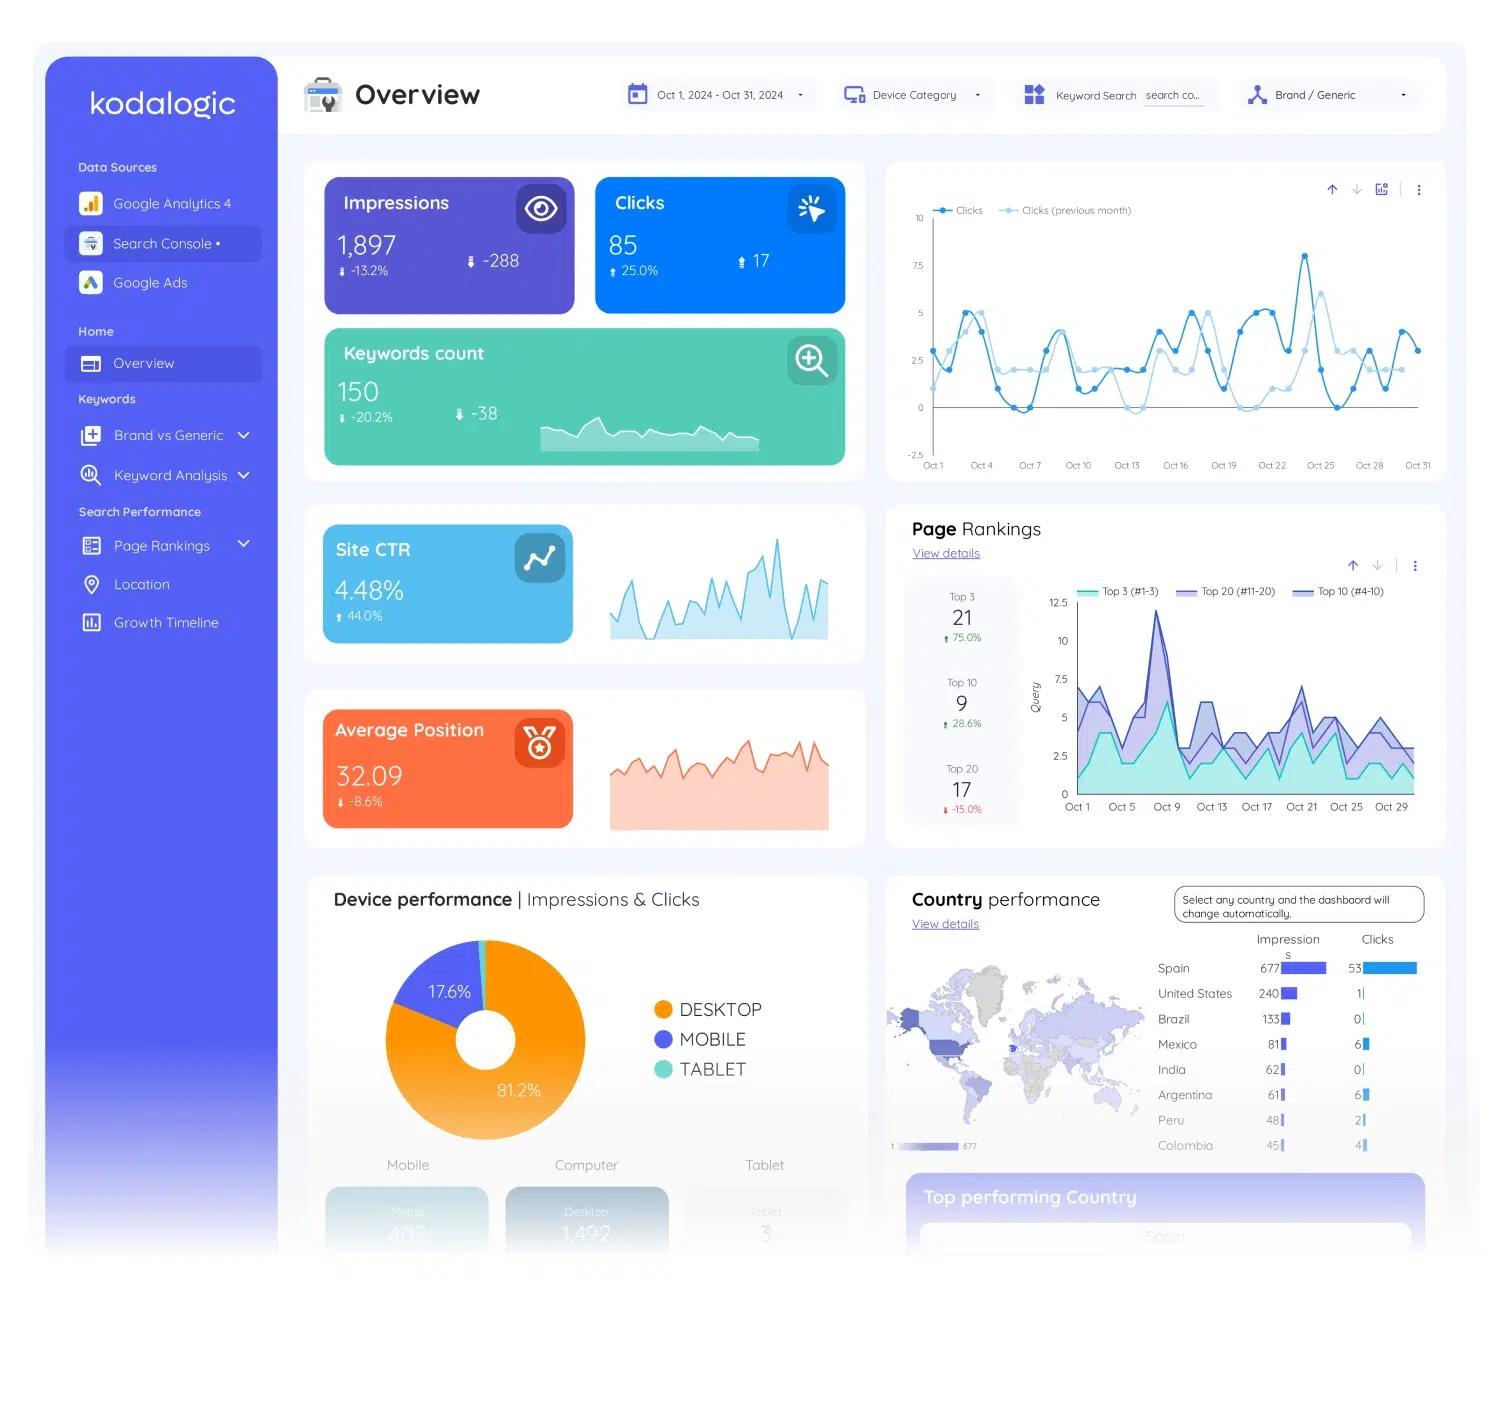
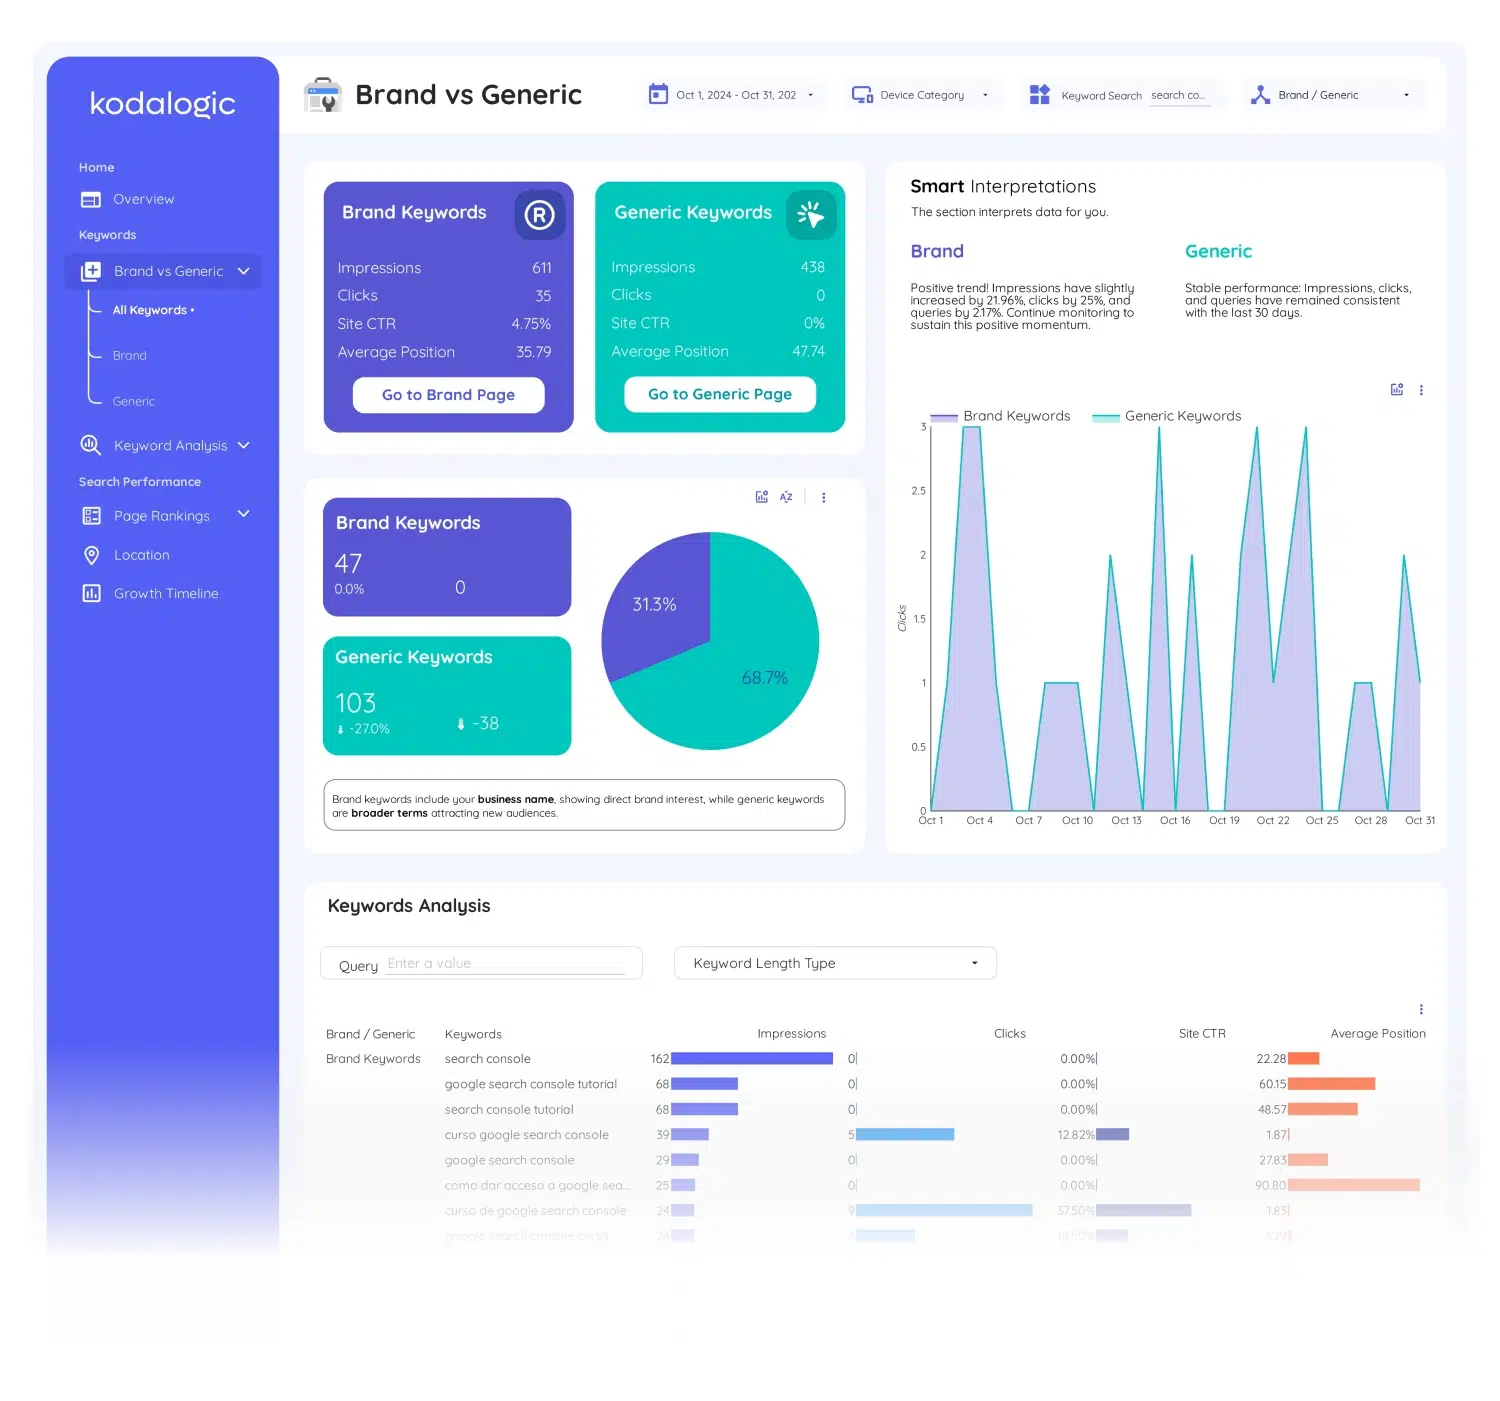
3. Google Search Console Dashboard
Best for: SEO teams that want deep keyword analysis beyond what Search Console's native interface shows.
Data source: Google Search Console
What it shows:
This is our most advanced keyword dashboard. It includes brand versus generic keyword segmentation, search intent classification (informational, navigational, commercial, transactional), keyword clustering by topic, ranking distribution across positions 1-3, 4-10, 11-20, and beyond, keyword movement tracking with period-over-period comparison, short tail versus long tail analysis, and geographic performance by country.
Smart Interpretations reads all of this live and writes automatic summaries of what's changing — which clusters are gaining, where CTR is falling despite stable rankings, and what the data suggests you do next.
Price: from $129 one-time payment
→ See the Google Search Console Dashboard
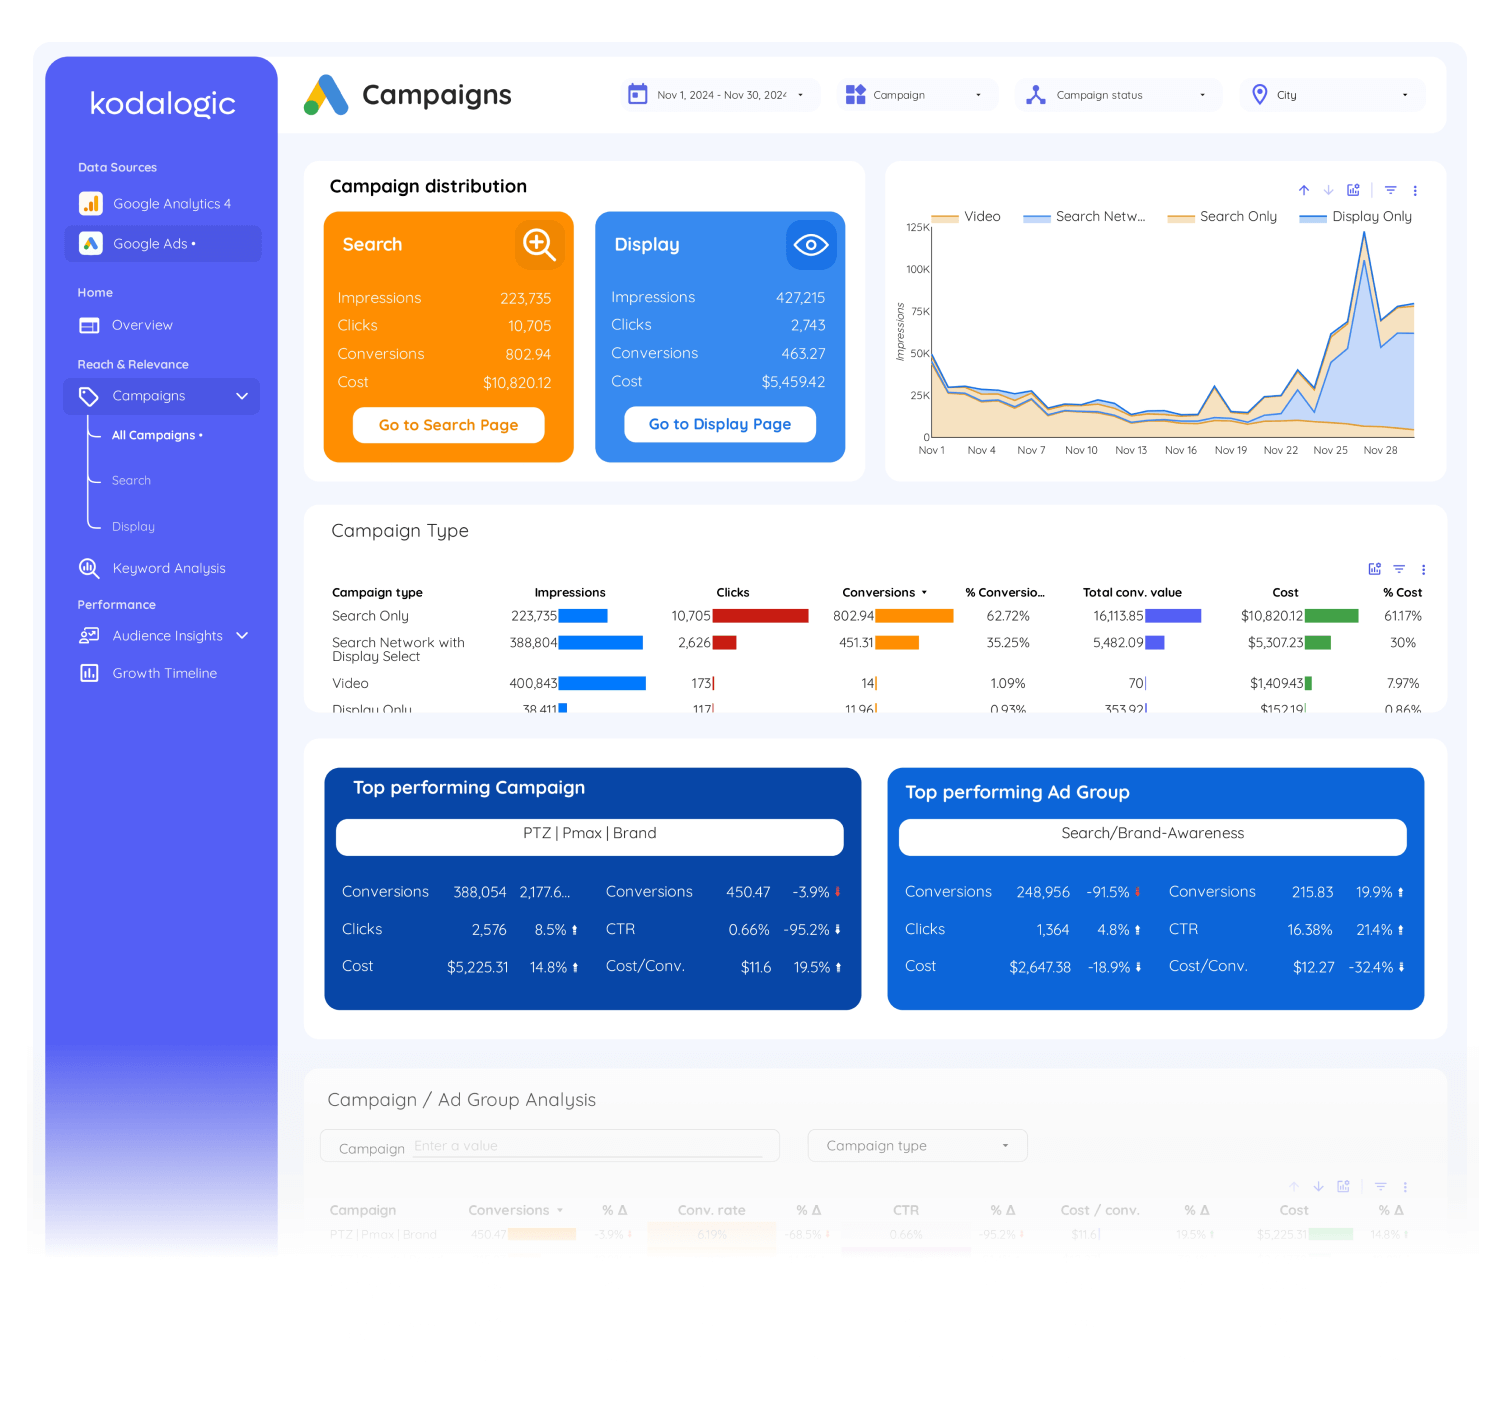
4. Google Ads Dashboard
Best for: PPC managers and agencies that need a clean, client-ready Google Ads reporting view without building it from scratch.
Data source: Google Ads
What it shows:
Campaign performance by spend, clicks, impressions, CTR, and conversions. ROAS tracking with period-over-period comparison. Keyword-level performance — top performers, underperformers, match type breakdown. Audience segmentation by device, demographics, and location. Smart Interpretations highlights budget efficiency issues and conversion anomalies automatically.
Why it's worth using instead of building your own:
A properly built Google Ads dashboard in Looker Studio takes 4-6 hours from scratch — getting the data connection right, building the ROAS calculated field correctly, setting up the comparison periods, and making the layout readable for someone who isn't a PPC specialist. This template starts working the moment you connect your account.
Price: from $129 one-time payment
→ See the Google Ads Dashboard
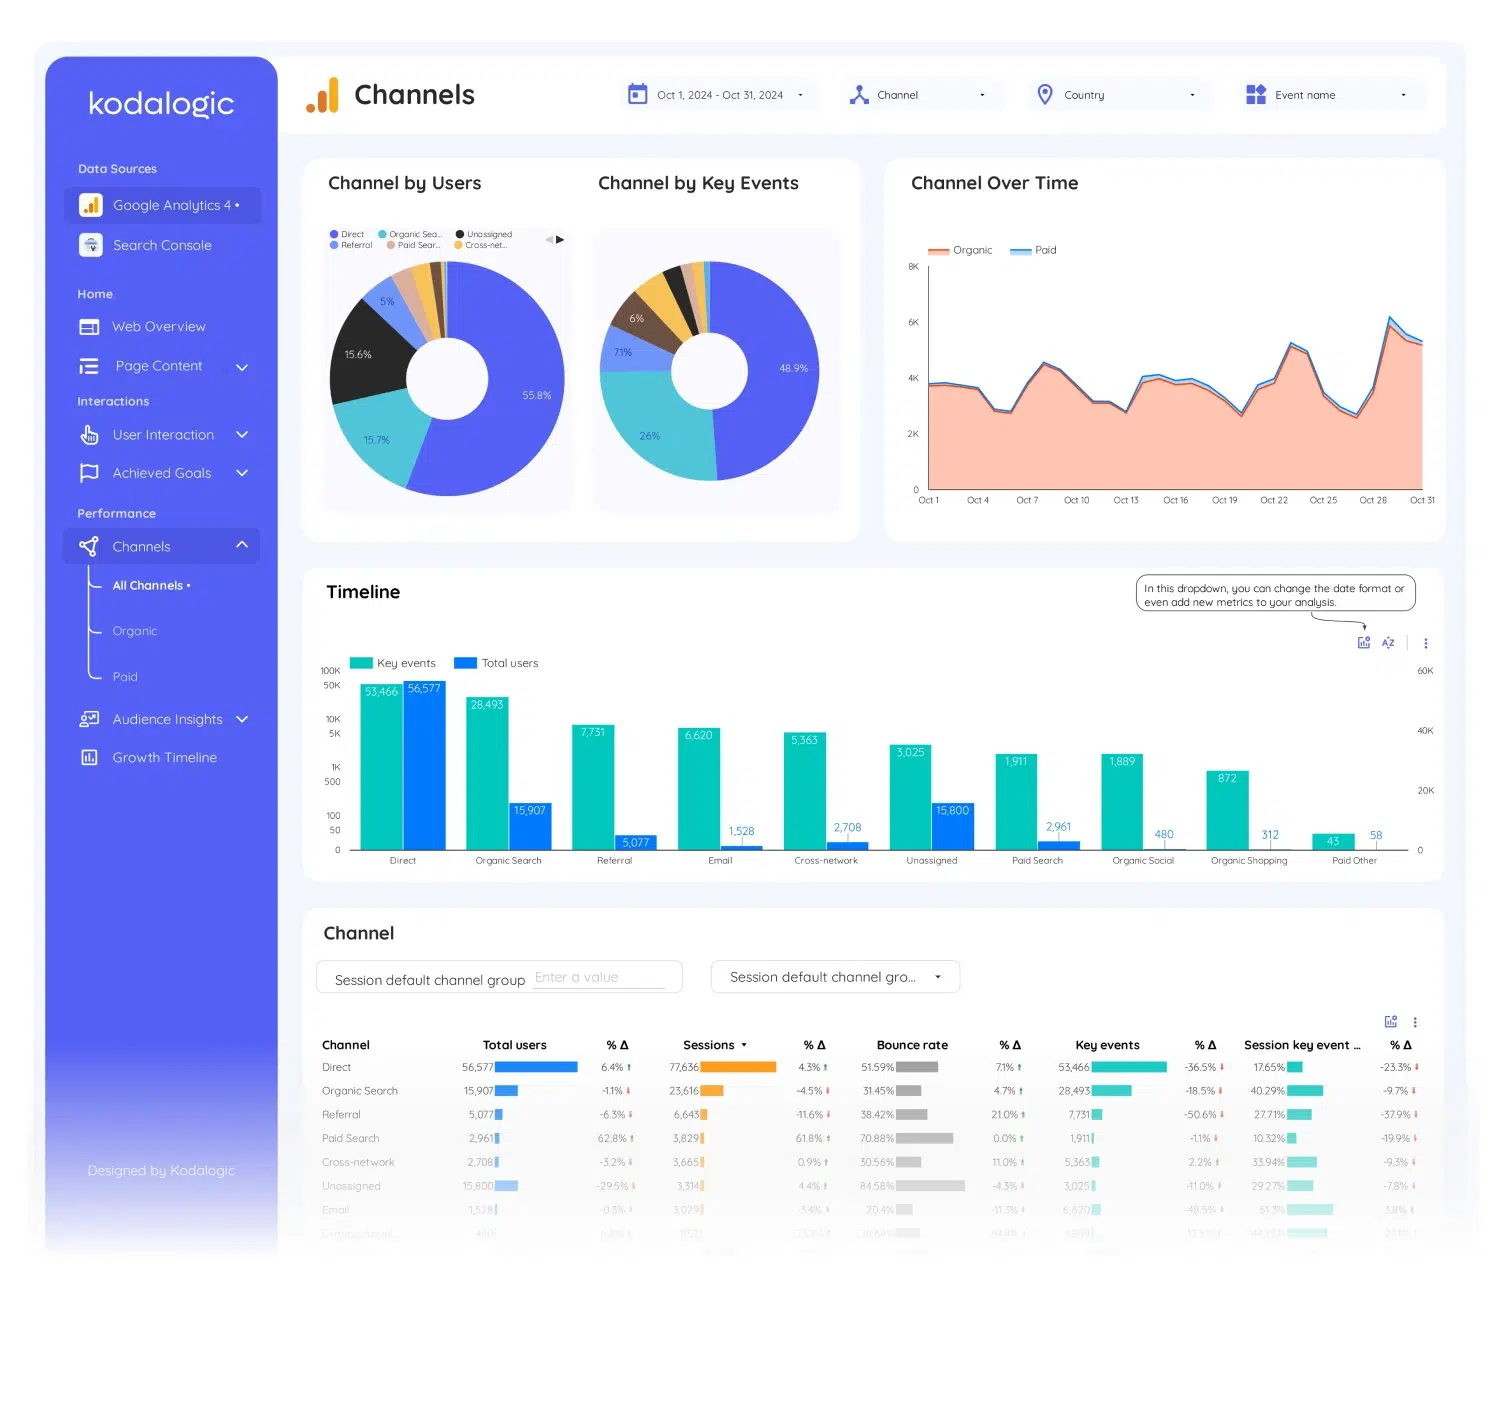
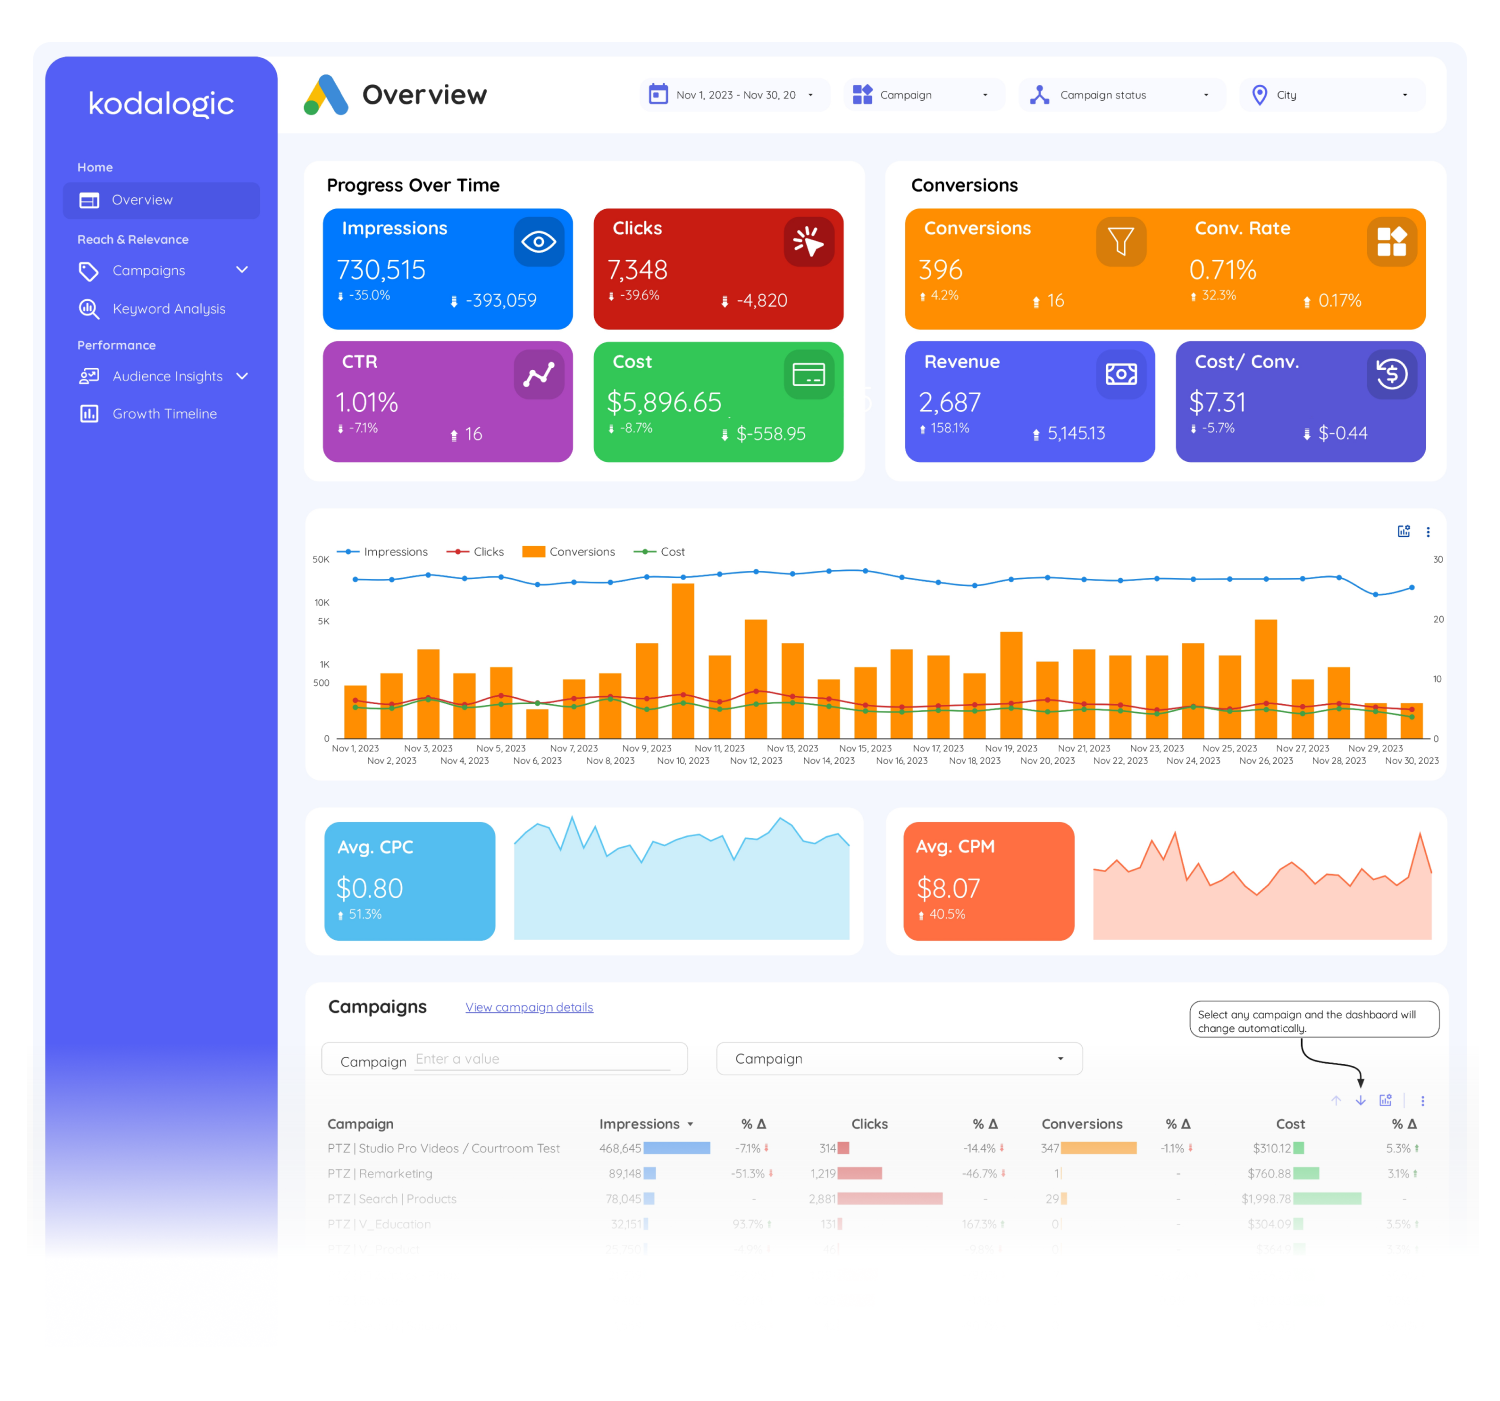
5. Google Analytics 4 Dashboard
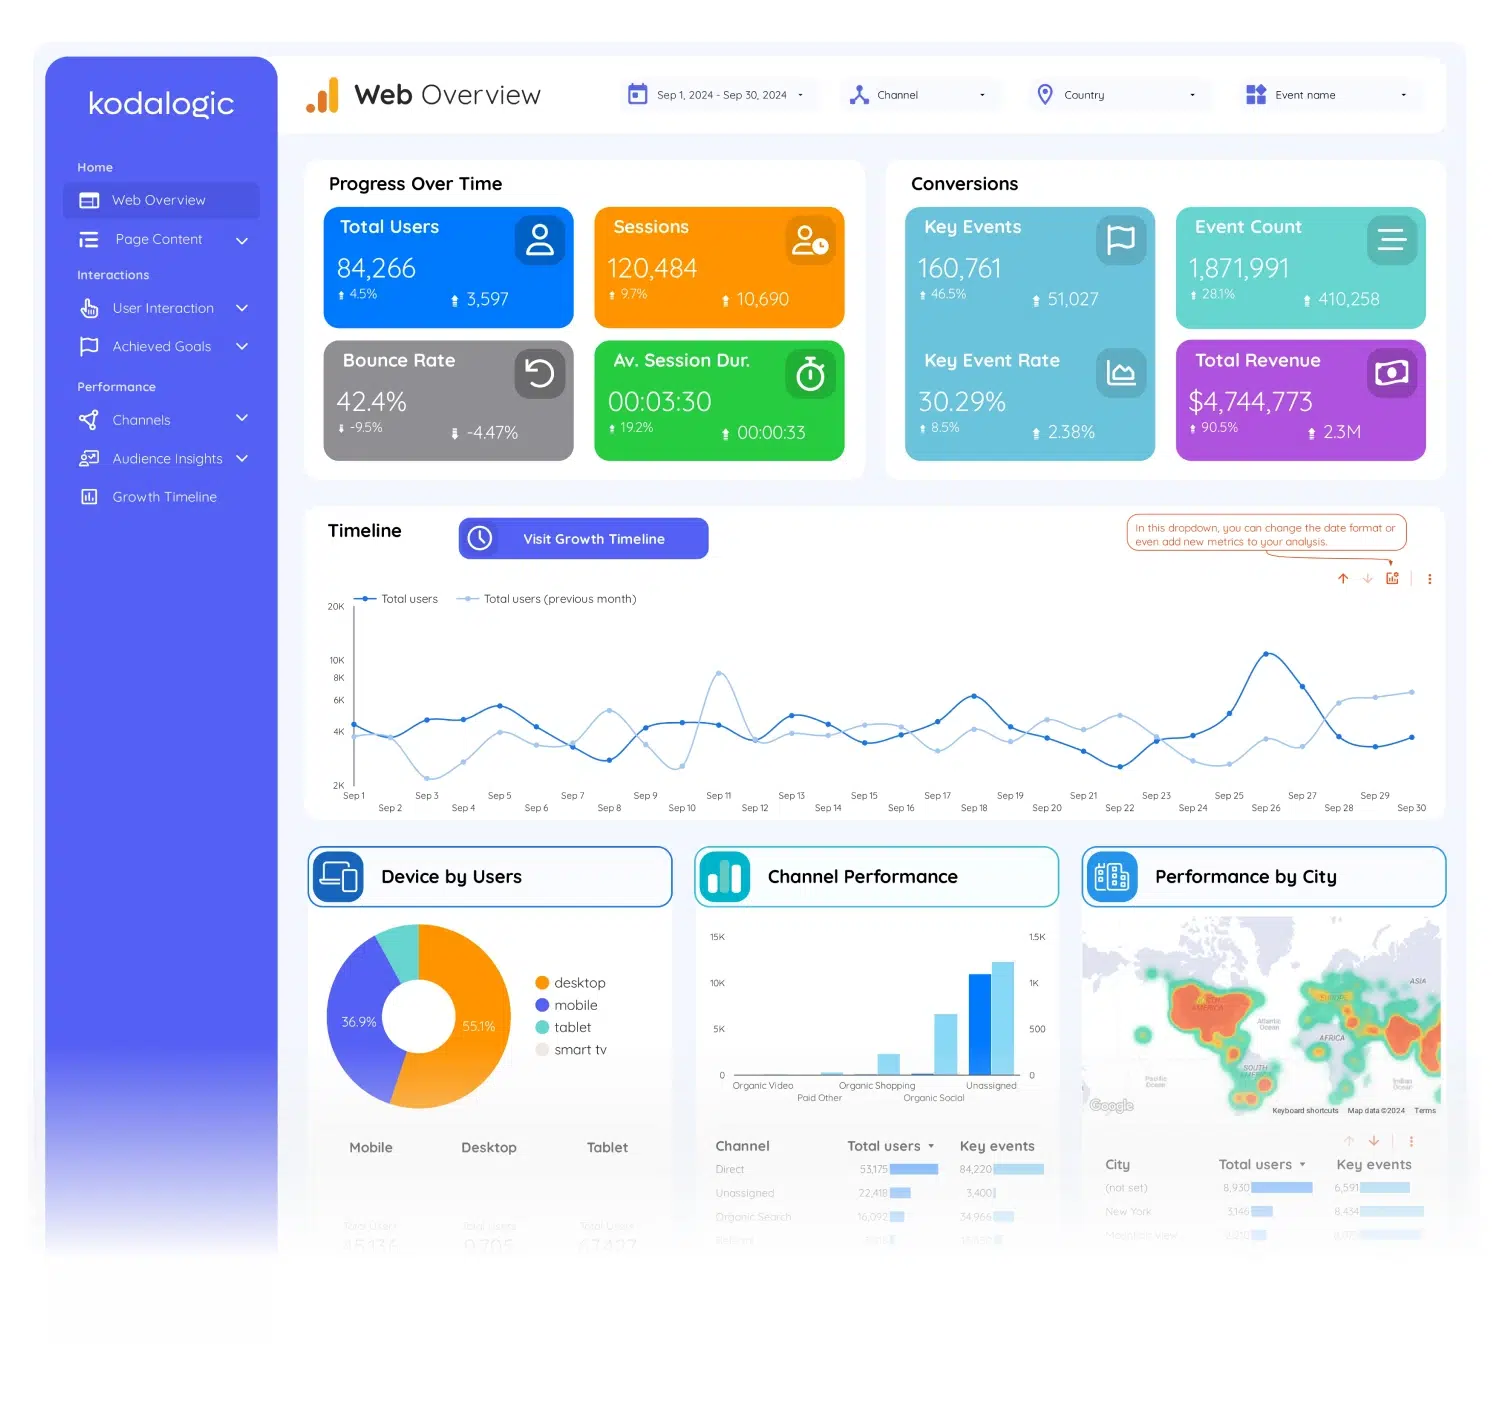
Best for: Anyone who moved from Universal Analytics to GA4 and still finds the GA4 interface confusing — or anyone who needs a cleaner reporting view for a client or stakeholder.
Data source: Google Analytics 4
What it shows:
Web overview with sessions, users, engagement rate, and bounce rate equivalent. User interaction detail — where users come from, what they do, where they drop off. Audience insights with demographic and interest segmentation. Page-level performance sorted by traffic, engagement, and conversions. Conversion tracking tied to GA4 events and goals.
GA4's native interface is powerful but not built for reporting. It's built for exploration. This template restructures your GA4 data into a format that's immediately readable — without needing to know where every metric lives in the GA4 interface.
Price: from $129 one-time payment
6. GA4 + Google Ads Dashboard
Best for: Teams running paid campaigns who need to see how ad traffic behaves on-site compared to organic — conversions, engagement, drop-off points.
Data sources: Google Analytics 4 + Google Ads
What it shows:
Google Ads performance — campaigns, keywords, spend, ROAS, and conversions — alongside GA4 behavior data for the traffic those ads generate. You can see not just whether a campaign is spending efficiently, but whether the traffic it sends actually converts, engages, or bounces immediately.
Price: from $214 one-time payment
→ See the GA4 + Google Ads Dashboard
How to Choose the Right One
The decision comes down to one question: what data do you actually have connected and what question are you trying to answer?
If you run SEO and content, the Google Search Console Dashboard gives you more keyword intelligence than any other single-source template on the market. If you run paid campaigns and need client-ready reports, the Google Ads Dashboard gets you there without the build time. If you manage both organic and paid and need one view, the All-in-One Dashboard is the one.
The Web & SEO and GA4+Ads combinations sit in the middle — they're for teams that work with two channels but not three, and want a tighter, faster dashboard than the all-in-one.
All of them share the same characteristic: they tell you what the data means, not just what the numbers are. That's what Smart Interpretations adds to every template in the list.
What About Free Looker Studio Templates?
There are free Looker Studio templates worth using — Google's own starter templates, the Search Console overview report, and a handful of community templates that are genuinely well-built.
The honest answer on free versus paid: free templates are good for getting started and terrible for ongoing reporting. They're built to be simple enough to work for everyone, which means they're not optimized for anyone. You'll spend hours customizing them, fixing broken references when you change a filter, and explaining to clients why the numbers look different from what they see in native Search Console.
The time cost of a poorly built free template — across a year of weekly reporting — is almost always larger than the one-time cost of a template that actually works.
If you want to try before buying, every Kodalogic template has a live demo. You can see exactly what loads before spending anything.
One More Thing: Smart Interpretations
Every template in this list includes Smart Interpretations. It's worth explaining what that actually means in practice.
Most dashboards show you a chart and leave the interpretation to you. Smart Interpretations reads your live data — your actual Search Console property, your actual GA4 account — and writes the analysis directly in the dashboard. When branded impressions fall while generic traffic grows, it says so. When a keyword cluster is gaining ground week over week, it flags it. When CTR drops despite a stable ranking, it surfaces the gap.
No other public Looker Studio template does this. It's not a chatbot, not an AI overlay — it's a structured analysis layer built into the dashboard itself that updates every time your data refreshes.