21 of February of 2025
Google Ads Dashboard in Looker Studio: The PPC Report That Runs Itself

Isaac Correa
Looker Studio Templates
Data Integration & Sources
Productivity & Automation
Get better PPC reporting with a Google Ads dashboard in Looker Studio. Track campaign performance, keyword rankings, and ad spend effortlessly.
The Google Ads interface gives you every number you could possibly want. What it doesn't give you is a clear answer to the only question your client actually cares about: is this working?
Why Google Ads Reporting Breaks Down in Practice
The Google Ads interface is not built for reporting. It is built for managing campaigns — and those are two completely different jobs.
Managing campaigns means filtering, adjusting bids, reviewing search terms, pausing underperformers. The interface is excellent for all of that. But when you need to step back and present a coherent picture of performance — what's working, what's wasting budget, what's driving real conversions — the native interface fights you at every step.
You end up exporting data. Pulling it into a spreadsheet. Formatting it. Writing a summary. Then doing the same thing next month, and the month after.
According to HubSpot's 2024 State of Marketing Report, marketing teams waste an average of 12 hours weekly pulling Google Ads data into spreadsheets. And the output of all that work isn't even good analysis — the same report found that 67% of marketers admit they're not tracking the metrics that actually impact business outcomes, focusing instead on vanity numbers like total impressions and clicks without conversion context.
A properly built Google Ads dashboard in Looker Studio solves both problems at once. It connects directly to your account, updates automatically, and structures the data around the decisions that actually matter.
This is what that structure looks like.
What a Google Ads Dashboard in Looker Studio Needs to Show
Most PPC dashboards fail for the same reason most Google Ads reporting fails: they show everything. Every metric, every campaign, every ad group, laid out in rows and columns that require a specialist to interpret.
A good Google Ads dashboard is built around decisions, not data. Every section should answer a specific question clearly enough that the person reading it knows what to do next without digging further.
These are the sections that earn their place.
Campaign Performance: Where Is the Budget Actually Going?
The first thing any client or stakeholder looks at is whether the money is being spent productively. But spend alone is not the answer. A campaign spending $5,000 a month with a ROAS of 0.8 is a problem. The same spend with a ROAS of 4.2 is working.
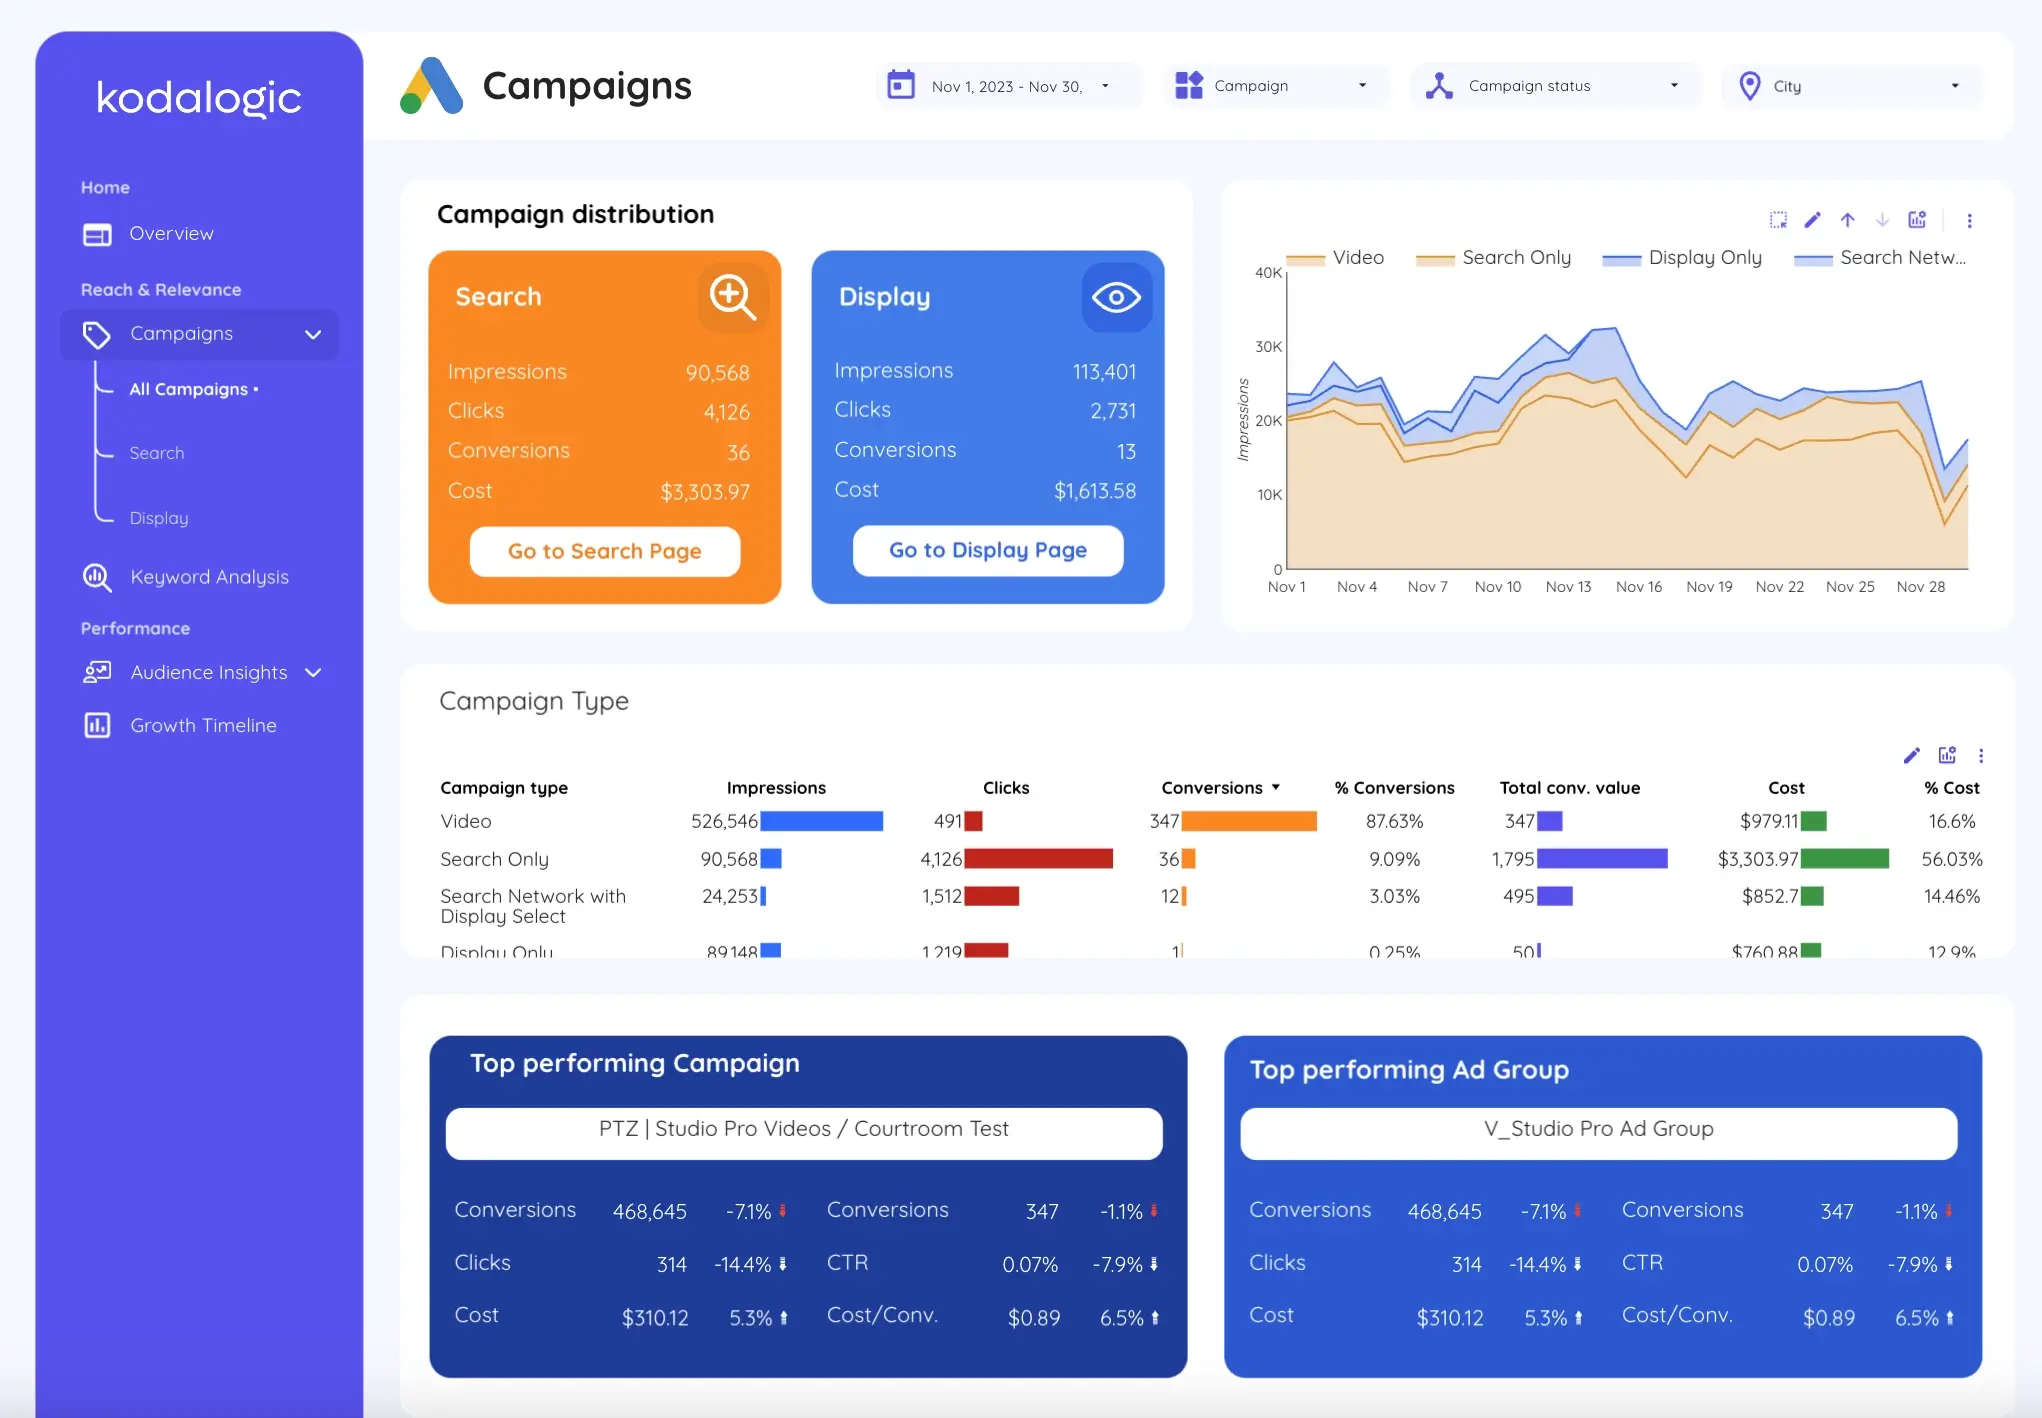
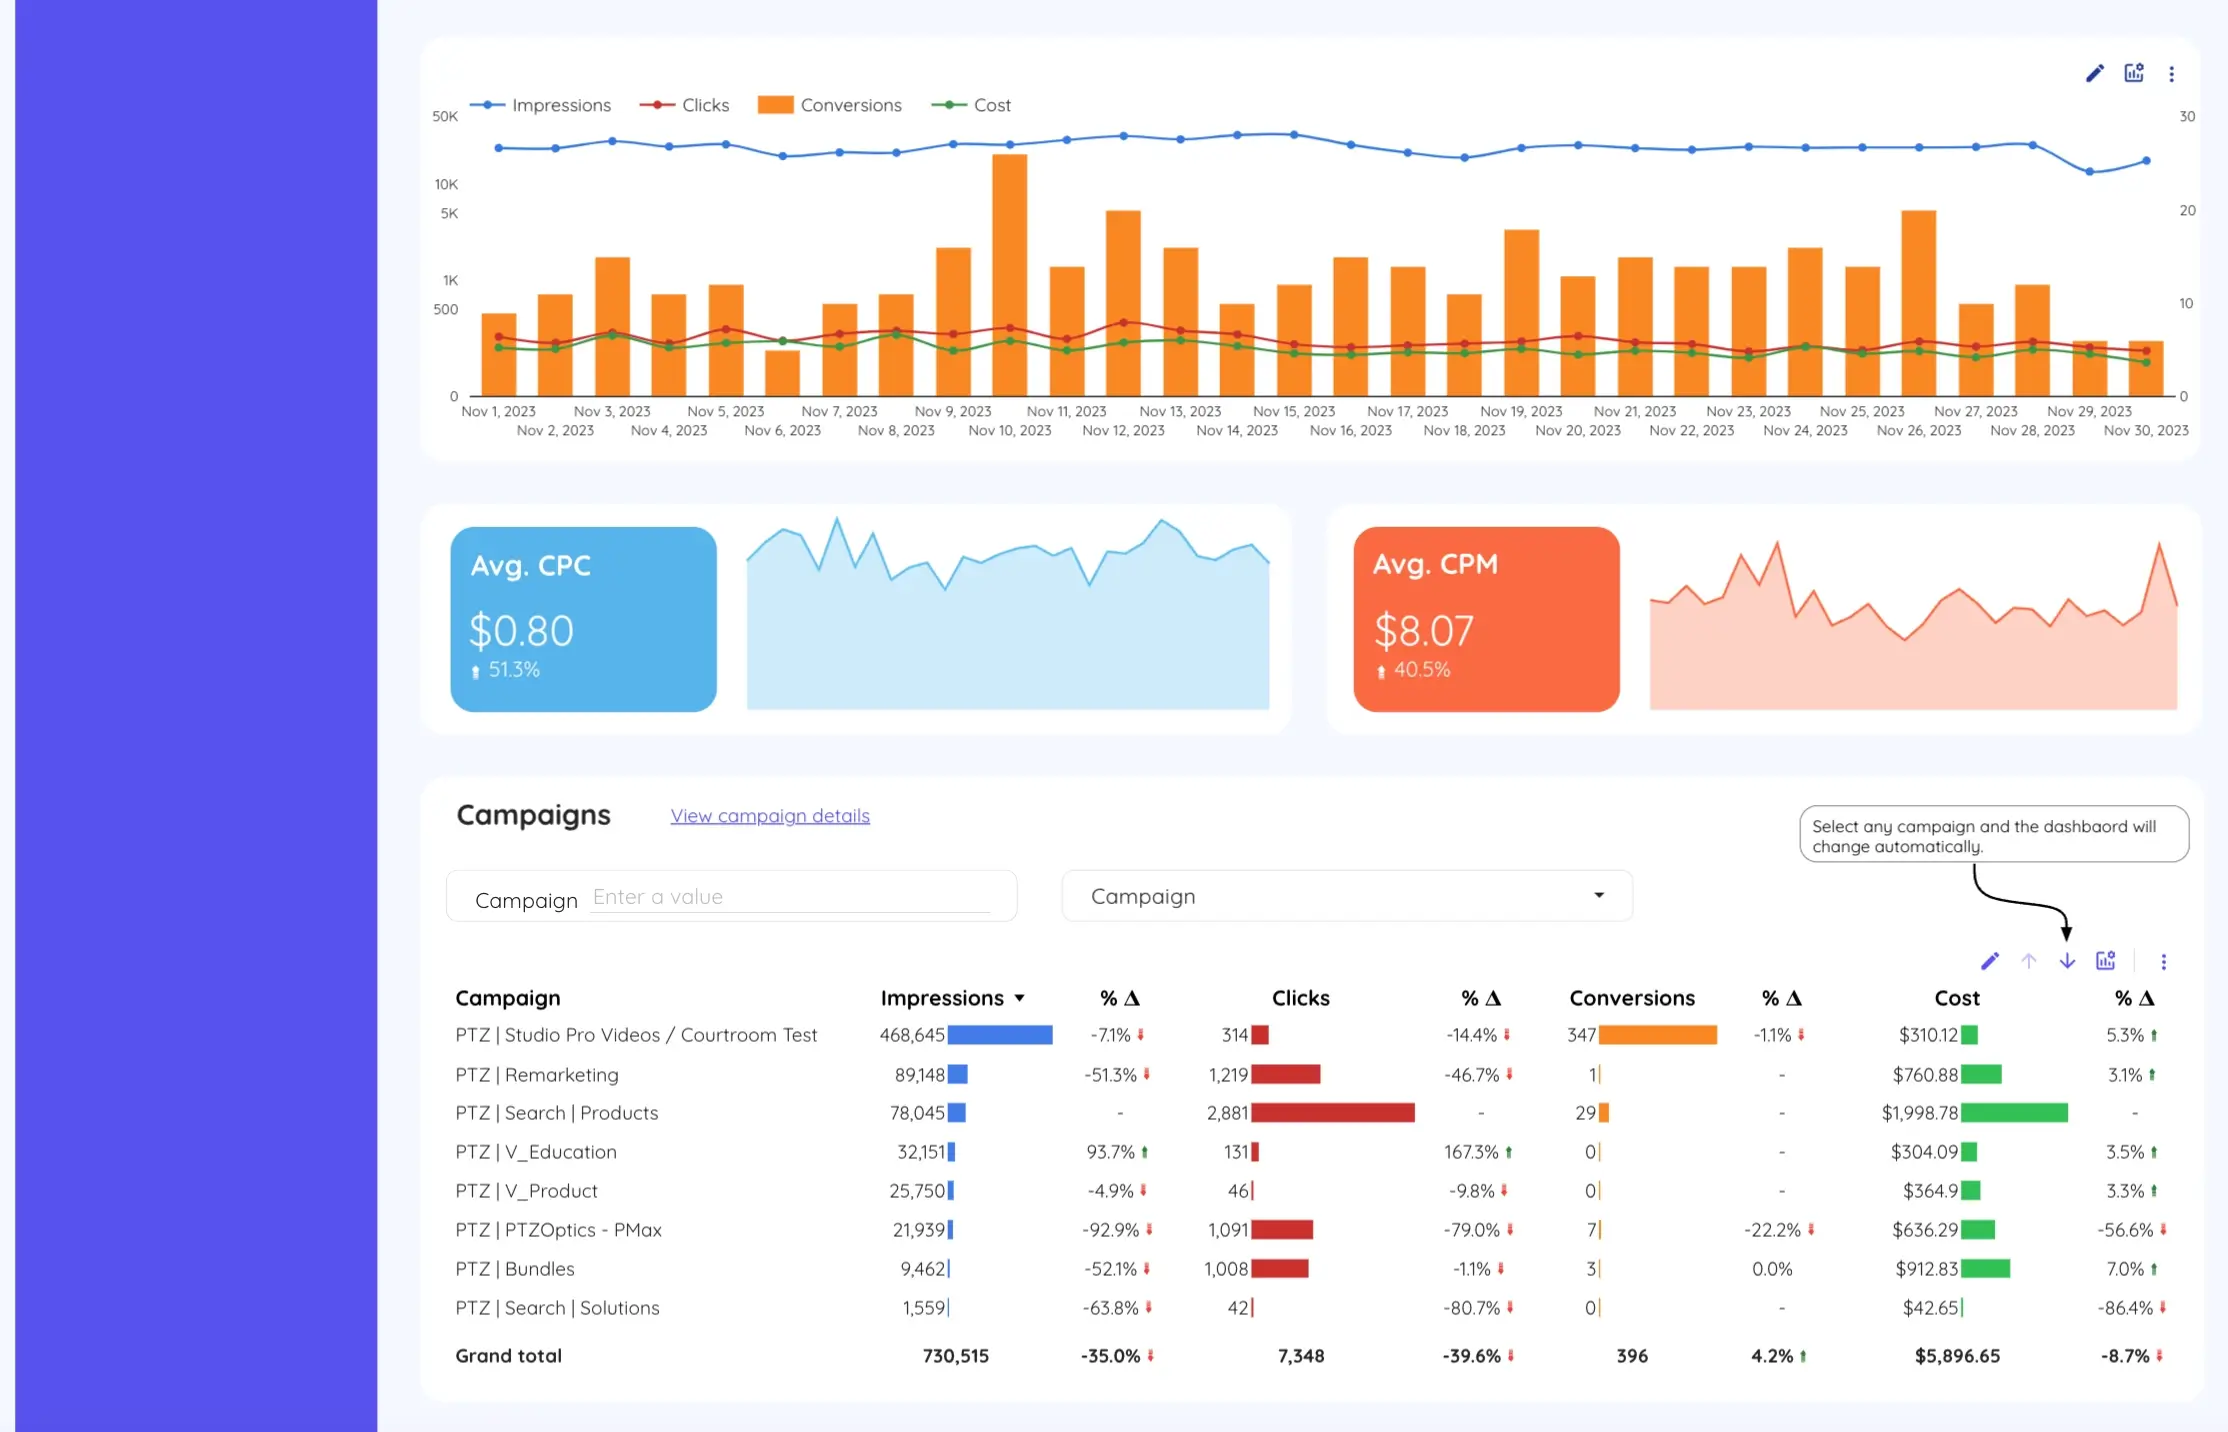
A proper campaign performance view shows spend alongside the metrics that give it meaning: conversions, cost per conversion, ROAS, and CTR — with period-over-period comparison so you can see direction, not just position.
It also separates campaign types. Search, Display, Shopping, Video, and Performance Max have completely different benchmarks. A 0.5% CTR on Display is normal. On Search it signals something is broken. A dashboard that mixes them into a single average number hides both stories.
The Kodalogic Google Ads dashboard shows each campaign type separately, with its own performance metrics and trend line. When a Display campaign is burning budget without converting, it shows immediately — without filtering, without exporting, without digging through the interface.
Keyword Performance: Which Terms Are Driving Real Results?
Keywords are where most Google Ads budget is won or lost. And the native keyword view in Google Ads — while functional for management — is not designed to communicate performance clearly.
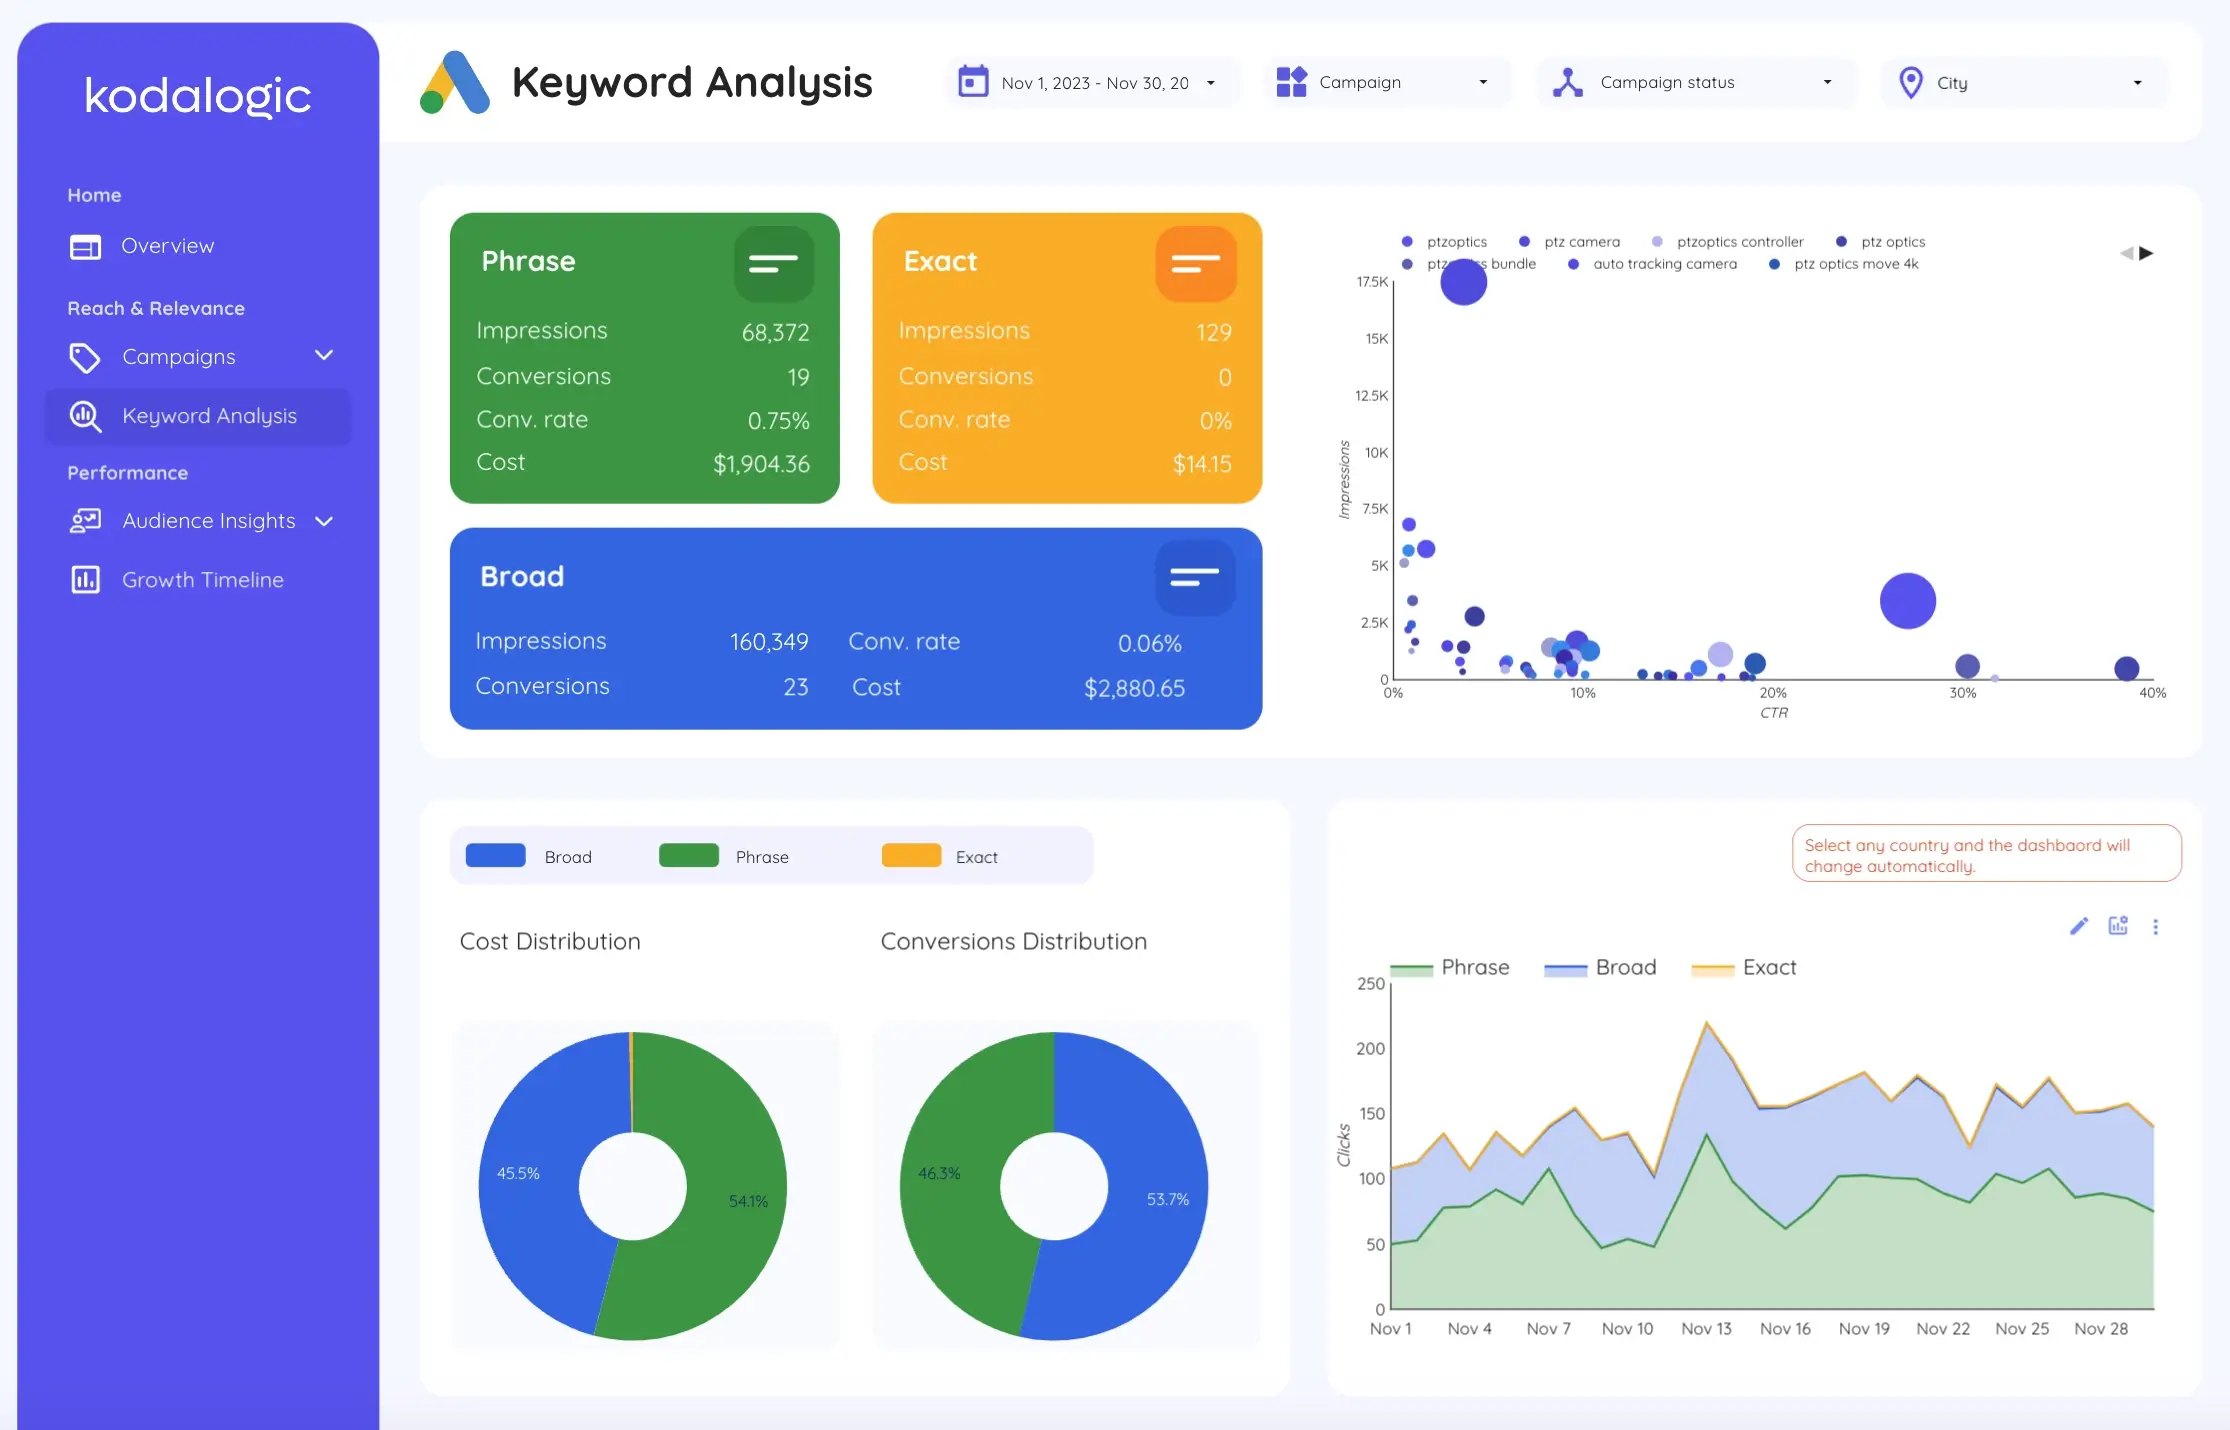
What keyword data needs to show in a reporting dashboard:
Match type breakdown matters because broad, phrase, and exact match keywords behave differently and should be evaluated separately. A broad match keyword driving traffic at a $200 CPA deserves different treatment than an exact match keyword driving the same traffic at $40.
Conversion attribution at the keyword level is what connects ad spend to actual business outcomes. Which keywords are generating leads or sales. Which are generating clicks that go nowhere. The gap between those two groups is where optimization lives.
Wasted spend identification is where the real savings come from. WordStream's 2024 benchmark analysis found that the average Google Ads account wastes 20 to 30% of its budget on irrelevant or low-intent searches. Surfacing the high-spend, zero-conversion keywords automatically — rather than requiring someone to manually sort and filter — is one of the highest-value things a PPC dashboard can do.
Audience and Geographic Insights: Who Is Actually Converting?
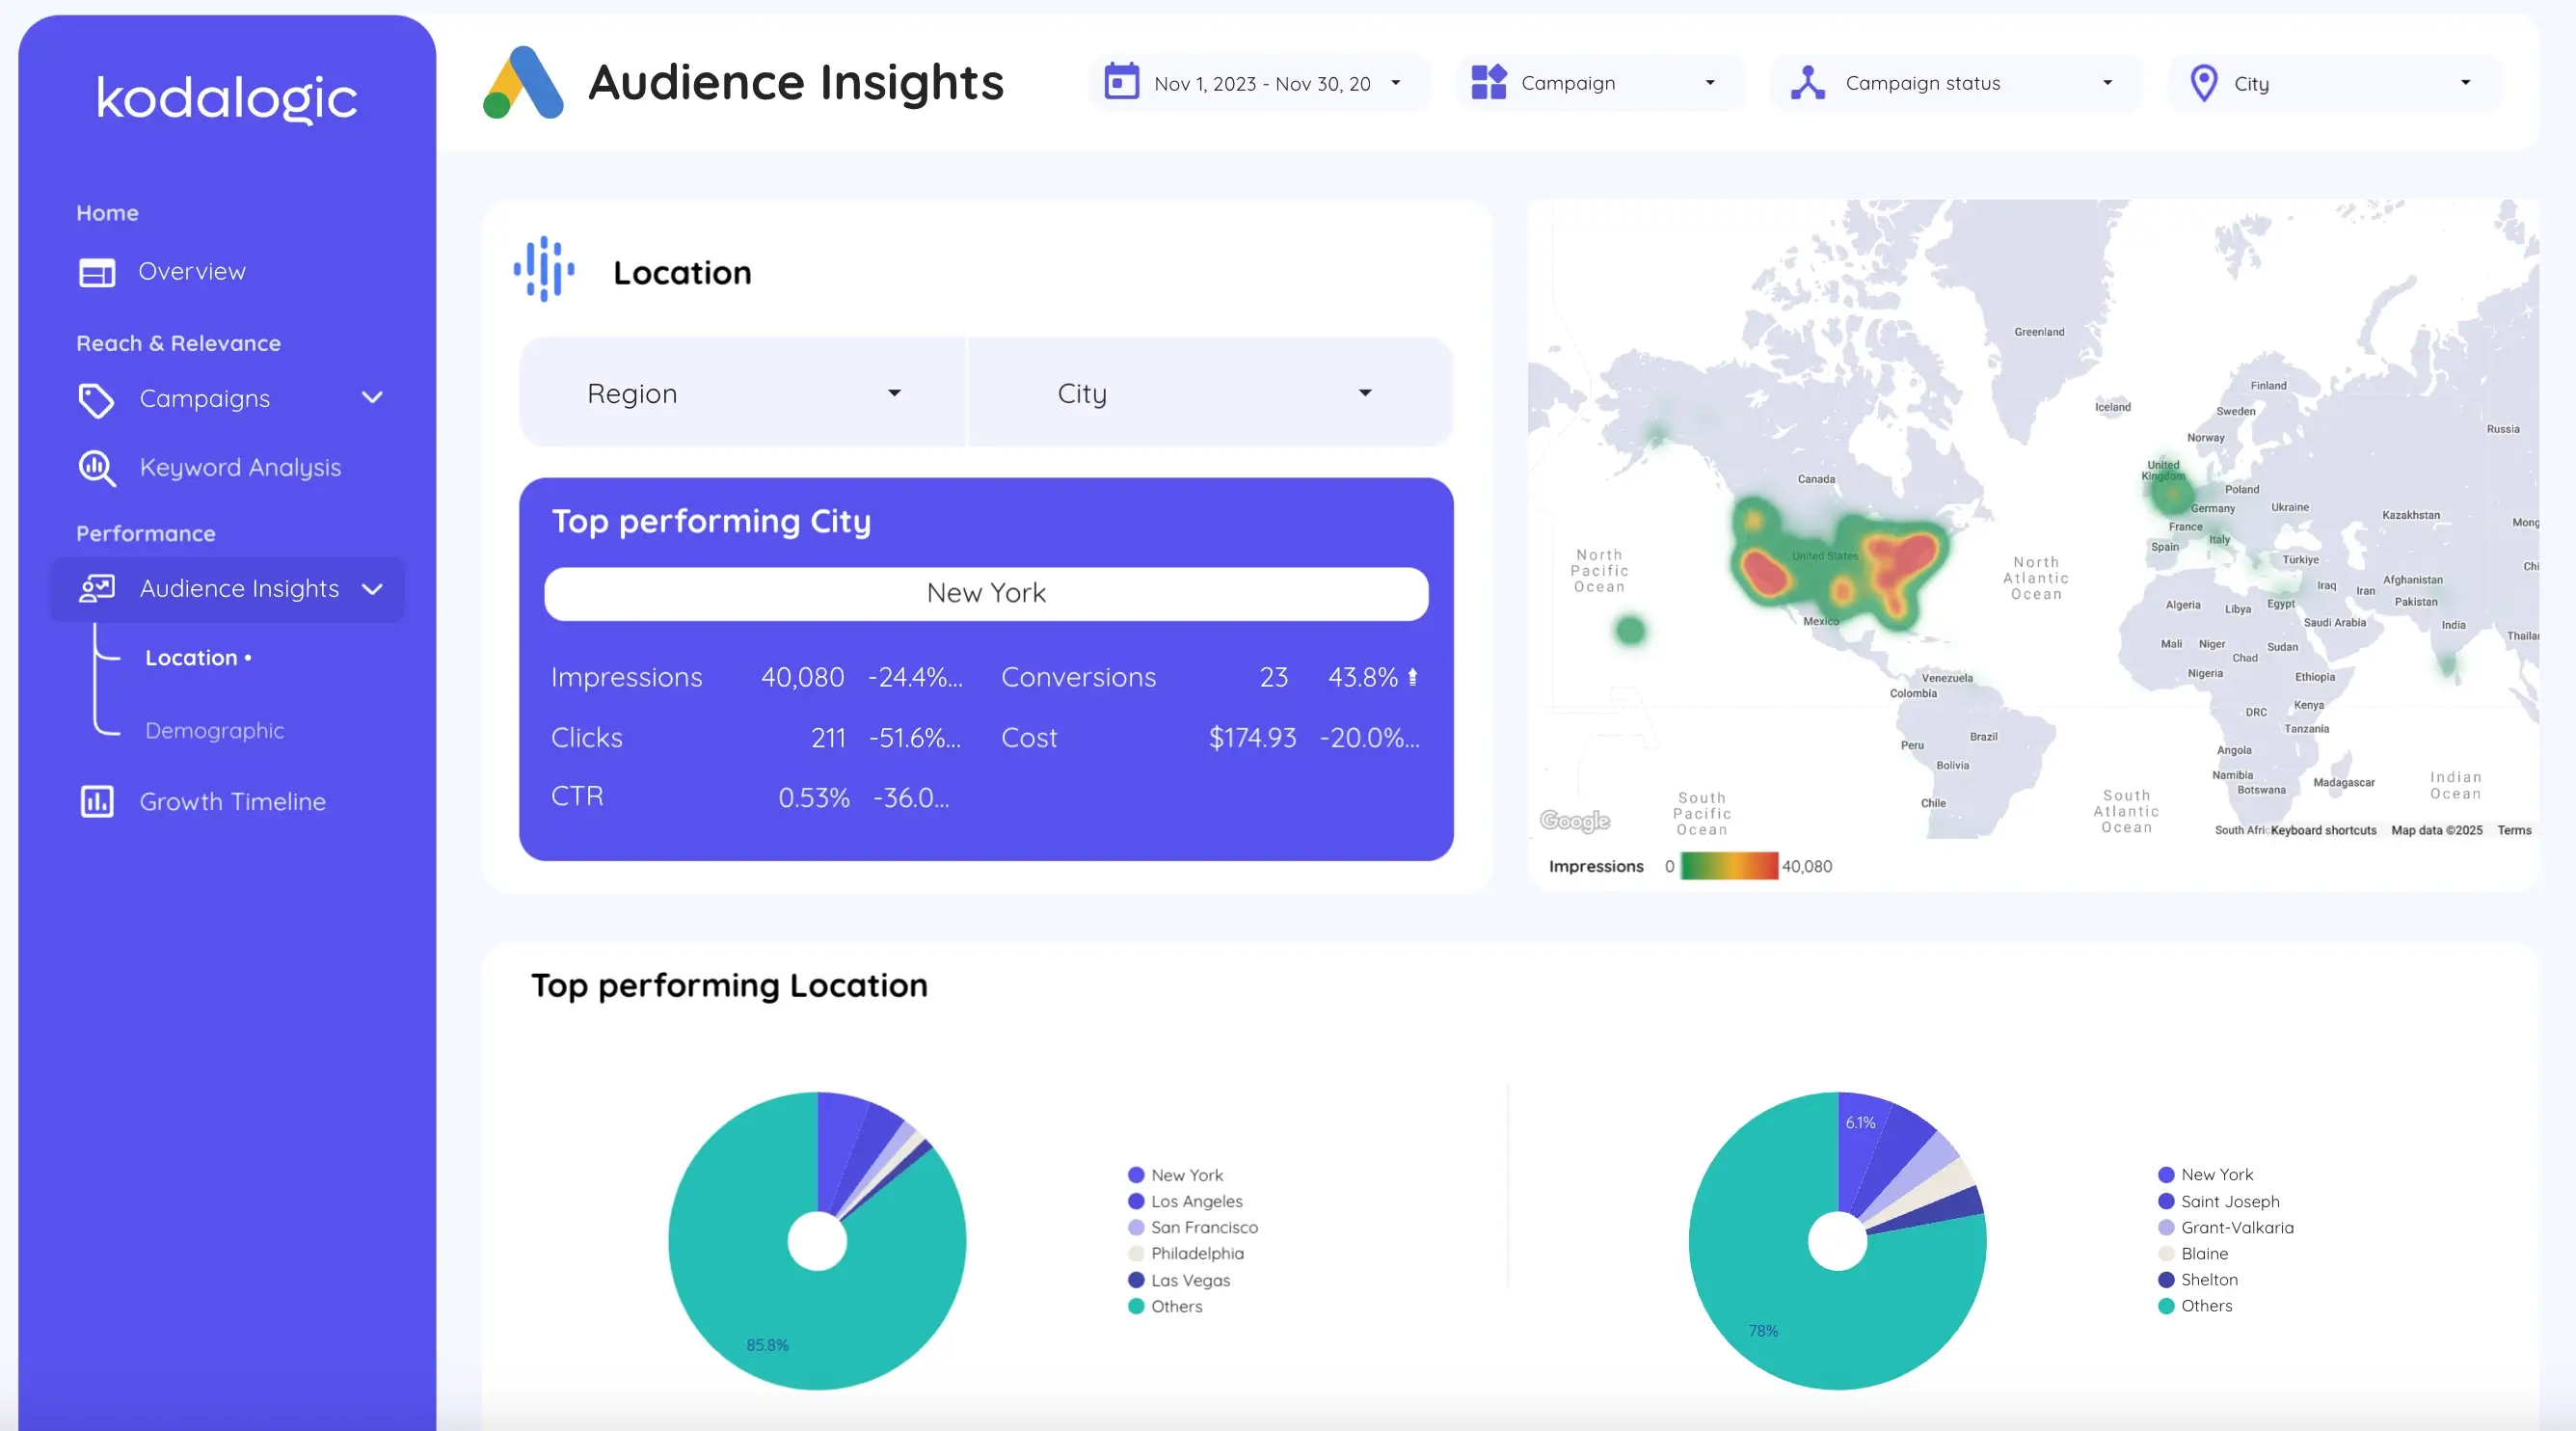
Aggregate ROAS numbers hide enormous variation in who is responding to your ads and where they are. A campaign averaging a 3.0 ROAS might be delivering a 6.0 ROAS to one demographic and a 0.8 to another — and the aggregate makes both invisible.
Audience segmentation in a Google Ads dashboard shows performance broken down by age, gender, and device type. Geographic performance shows which countries, regions, or cities are converting efficiently and which are consuming budget without return.
These views matter not just for reporting but for optimization. When a location is consistently underperforming, the bid adjustment is straightforward. When a demographic segment is dramatically outperforming the average, there is a scaling opportunity. Neither action is possible without seeing the segmentation clearly.
ROAS Trends Over Time: Is Performance Improving or Drifting?
A single month's ROAS number tells you almost nothing useful on its own. The trend over time is what tells the real story.
Is ROAS improving as campaigns learn and optimize? Declining as competition increases CPCs? Fluctuating seasonally in a pattern you can plan around? Dropping suddenly in a way that suggests something changed in the account or the competitive landscape?
Historical trend views answer all of these questions without manual comparison of different date ranges. The dashboard shows the trajectory automatically, updated every time data refreshes from Google Ads.
For agencies managing multiple client accounts, this is where the difference between a dashboard and a report becomes most clear. A report is a snapshot. A dashboard is a continuous view of what is happening — and trend analysis is only possible with continuity.
Why Looker Studio Is the Right Platform for This
Looker Studio connects directly to Google Ads through Google's native connector — free, first-party, no middleware, no export cycle. Data flows from the source into the dashboard and updates automatically.
The limitation has always been build time. A properly structured Google Ads dashboard in Looker Studio — with correct ROAS calculated fields, campaign type separation, keyword segmentation, audience views, and comparison period logic — takes significant time to build correctly. Most teams either use a generic template that does not fit their workflow or spend days building something custom that breaks when campaign structure changes.
The Kodalogic Google Ads dashboard template connects to your account and populates immediately. Every section described above is already built and structured around the decisions that matter. You connect the data source and start using it.
For agencies managing multiple clients, the same template connects to different Google Ads accounts — same structure, same layout, same reporting logic, different data. Setup for a new client is minutes, not days.
Connecting Google Ads to GA4: The Full Picture
Google Ads data tells you what happened with the ad. GA4 tells you what happened after the click.
A campaign with strong ROAS in Google Ads but a 90% bounce rate in GA4 is a landing page problem, not a campaign success. A campaign with modest Google Ads ROAS but strong post-click engagement and high conversion rate in GA4 tells you where to scale budget — because the offer and the landing page are working, the constraint is just traffic volume.
The GA4 + Google Ads dashboard combines both data sources in a single view. You see ad performance and on-site behavior together, which is the only way to make fully informed decisions about where to spend and where to cut.
For teams that also run organic search alongside paid, the All-in-One Dashboard adds Google Search Console — so you can see which keywords you are paying for in Google Ads while also ranking for organically, which is one of the most common sources of wasted PPC budget.
Scheduling and Delivery: The Report That Runs Itself
Once the dashboard is built and connected, Looker Studio's scheduling feature handles delivery automatically. You configure the cadence — weekly, monthly, whatever the client needs — and the report goes out with fresh data without anyone touching it.
We cover the exact setup in our guide on how to schedule a Looker Studio dashboard for email delivery. The combination of an automated data connection and scheduled delivery means the Google Ads reporting workflow goes from hours of manual work per client to essentially zero ongoing time.
That is the full stack: data connects automatically, updates automatically, and delivers itself automatically. The human work is reviewing what the dashboard surfaces and deciding what to do about it — which is the only part of the process that actually requires a person.
→ Get the Kodalogic Google Ads Dashboard Template